Understanding and Solving Common Problems of General Linear Models (GLMs) in R.
Published
December 12, 2023
Common Issues with GLMs
Gaussian Example
So we have done multiple step by step guides of GLMs with different distributions and how to check assumptions are okay, and surprise surprise they have been fine or at least acceptable for our purposes. What happens when it isn’t acceptable? Following the step by step processes we will probably find issues at the checking residuals stage. So here we will make a Gaussian model, check the residuals and see some issues, then we will work out the best ways to deal with these problems. We won’t go through how to summarise and then interpret results from these models as once we are happy the methods will be the same as the other GLM tutorials.
Data Loading - Lets go Back to Penguins
We will use the Penguins data set again, but this time we will not take into consideration the causal implications of Sex or Species for the morphometric bill_depth_mm. This would not make any sense with a dataset where different species and different sexes of these species are present.
Here we will see if the effect of flipper length on the depth of the bill.
This is a fairly simple model with one fixed effect and can be written as:
Bill Depth ~ Flipper Length
Step Two - Resonse Variable Distribution
As before when we modelled flipper length, bill depth is technically Gamma distributed but a linear model will work well.
Step Three - Organising Fixed Effects
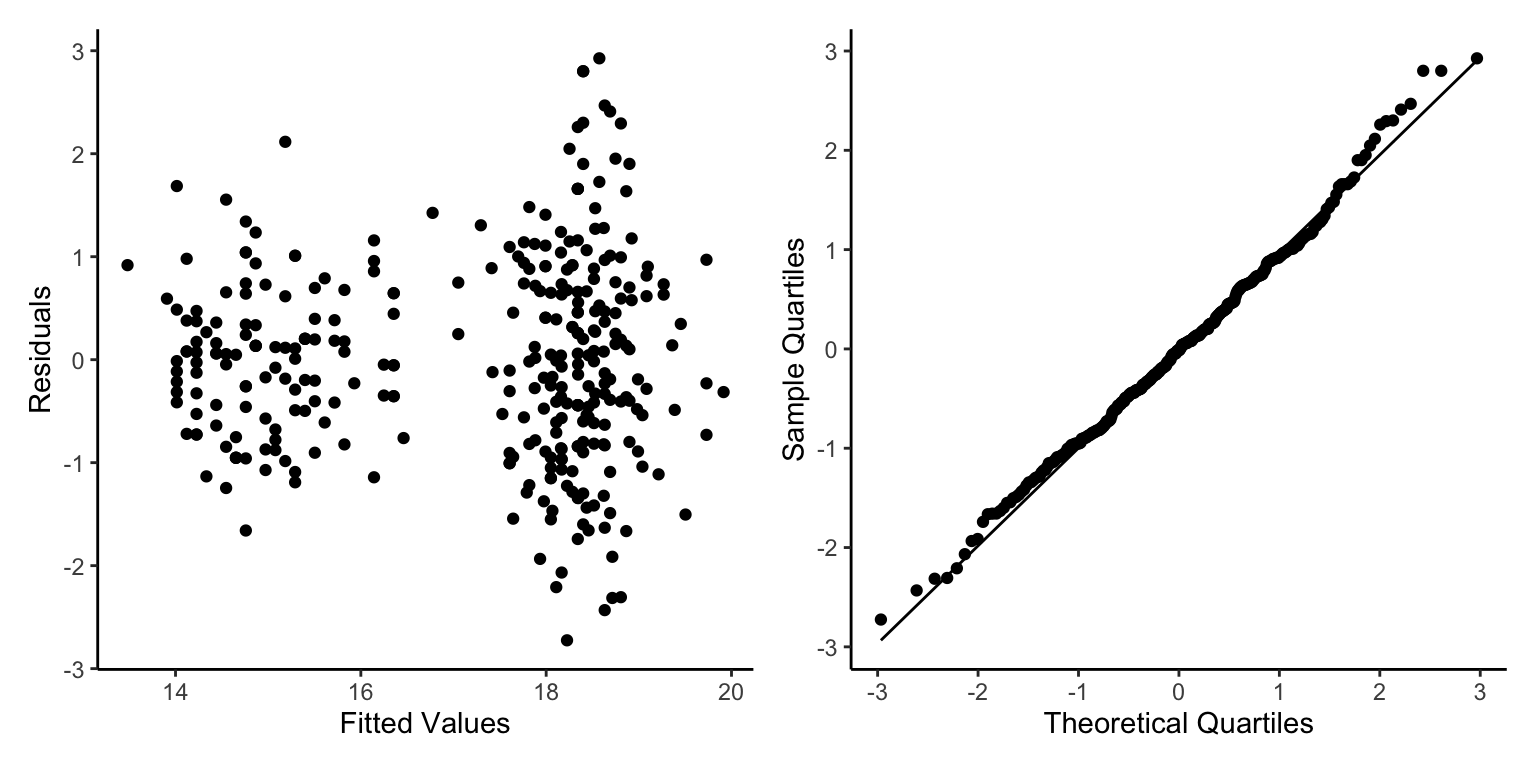
Our data are fairly well distributed across the values, although there are two clear peaks. HINT HINT - This might cause issues if we haven’t taken into consideration why there are two peaks (one of which is twice the height of the other).
Ahhh No, this looks pretty bad. Well the qqnorm plot looks good actually, but the residuals vs fitted values has clear patterns that cannot be ignored.
What is wrong and How do we fix it?
So for us to see such strong patterns in our residuals vs fitted plot there are a number of different issues that could be causing this:
We have used the wrong distribution,
We haven’t modelled the structure of the data properly,
We have ignored issues in the sampling that created inherent bias in the data,
Our data have excessive numbers of 0s (either caused by our sampling methods or precision issues).
1) Wrong Distribution
If we have used the wrong distribution we should remodel with the correct distribution. This can happen especially for poisson models where there is high levels of variance. The poisson distribution expects variance to be proportional to the expected value. When there is significant over dispersion of values we can use a different distribution called the negative binomial distribution.
2) Wrong Model Structure
If we have modelled the data structure incorrectly, i.e. ignored the difference in the relationship of bill depth and flipper depending on different species, then we need to include that structure in the model. Sometimes this will be some sort of hierarchy, repeat measures or multi-level structure, to model this correctly we will need to use mixed effect or multi-level models (General Linear Mixed Effect Models: GLMMs, we will go through these in future tutorials).
3) Inherent Bias in Sampling
This is a more complex issue. This could, for example, be that we only sampled male gentoo penguins and female chinstrap penguins, thus our ability to split by sex and species to model the data structure properly will be impossible. In many situations, if we know the bias we could perhaps model within one of the groups, just male gentoo penguins, but this would mean our model was only applicable to this group. Other times we may have a sampling cut off/threshold, which may or may not be acceptable. For example, when measuring penguins there may be ethical issues/sampling protocols of measuring individuals smaller than a certain size, as it could harm their parent-chick relationship, or cause too much distress to the individual. This will effectively mean you miss data below a certain size. Often this can be acceptable as long as the interpretation of the model takes this into consideration.
4) Zero or One Inflated Data
Zero (or one) inflation of data can have multiple root causes, such as sampling bias as mentioned above, also subsetting of multivariate datasets e.g. we have catch data for a experimental trawls. From the trawls we get abundance per trawl of all the different species caught, but we are interested in just one species and its abundance. Sometimes this means trawls will have high numbers of zeros for this species. Sometimes zeros will not cause issues but sometimes high numbers of zeros will cause clear patterns in both the residuals vs fitted and qqnorm plots. When this happens we can employ zero inflated or zero adjusted versions of the model we want. This is effectively creating two models in sequence. Firstly, we model the presence or absence with a Bernoulli model, then when there is presence we model all non-zero values with the desired distribution (We will also explore these models in a future tutorial).
Solution
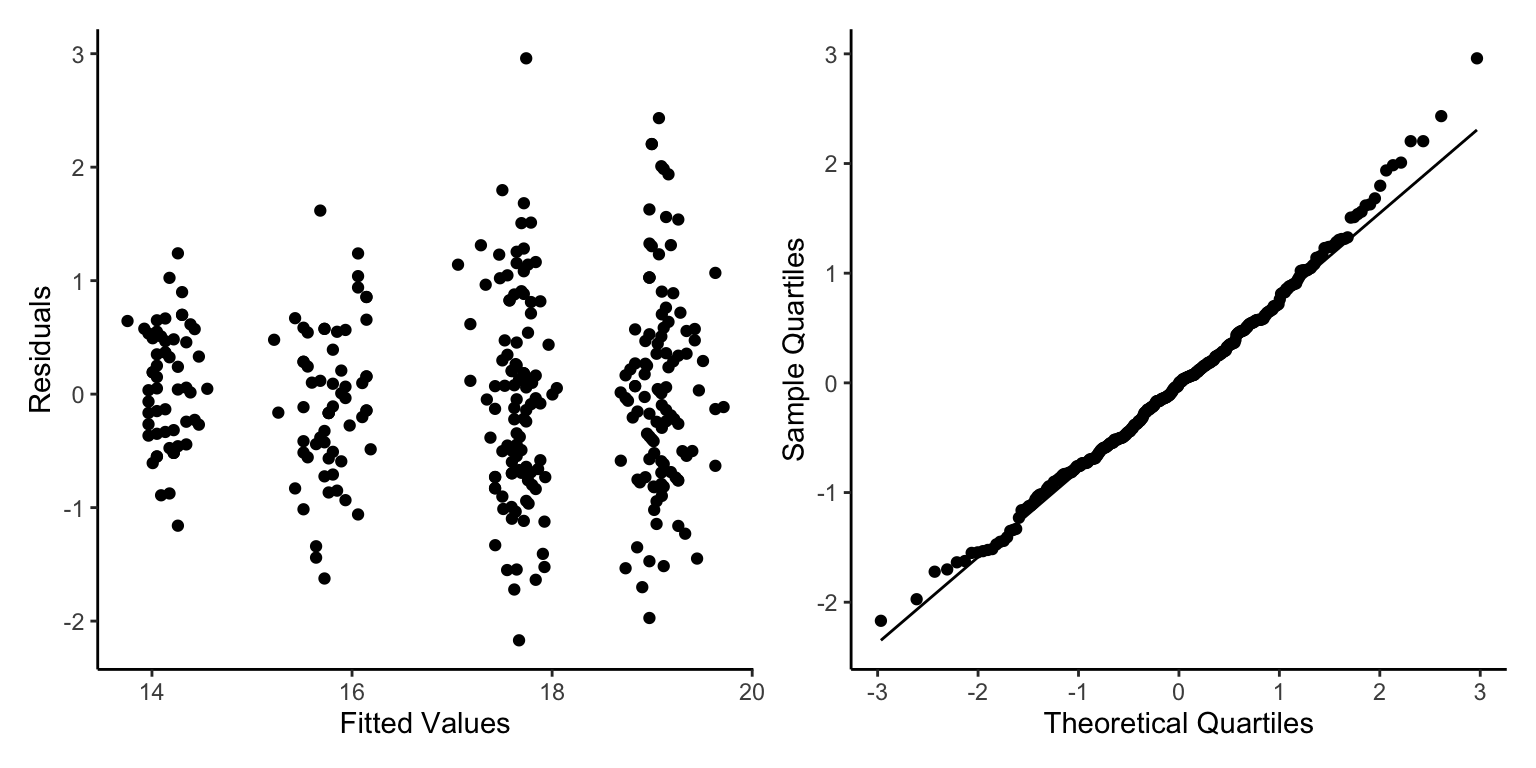
While we could go down the GLMM route here, we can also model the species into our model to sort the issues we found.
This is a lot better, but again we can see two clear groups of points with different spreads, what other element of our data has two factors that we may have missed?
This is better, but not perfect as we still see some patterns, but generally our points are more evenly distributed above and below the 0 line.
Poisson with Overdispersion
Galapagos
Here we will bring the Galapagos dataset back. When we used this for a poisson model we talked about it having high levels of over dispersion. We ignored it before to give the example, but lets now actually take action.
So how do we the fit a negative binomial model? We need to load another package as the negative binomial distribution in glm() needs to already know the overdispersion, whereas we won’t know it and will want to estimate it within the model! To do this we can use the glm.nb() function from the MASS package. Note of caution: the MASS package has a function called select() this will conflict with the select function from dplyr we use for data manipulation - Be aware!
#install.packages("MASS")library(MASS)
Attaching package: 'MASS'
The following object is masked from 'package:patchwork':

    area
The following object is masked from 'package:dplyr':

    select
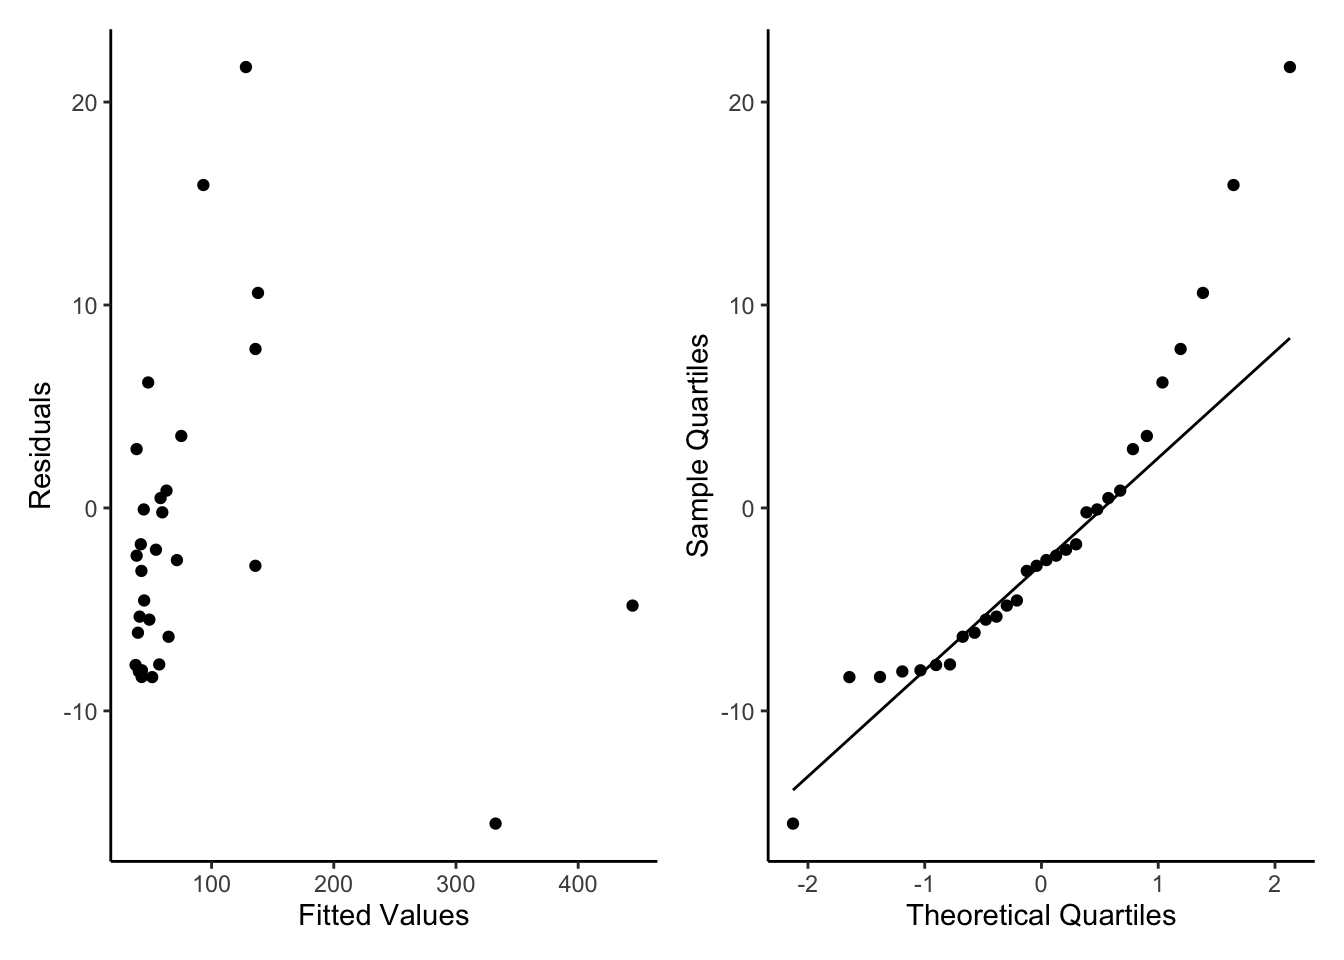
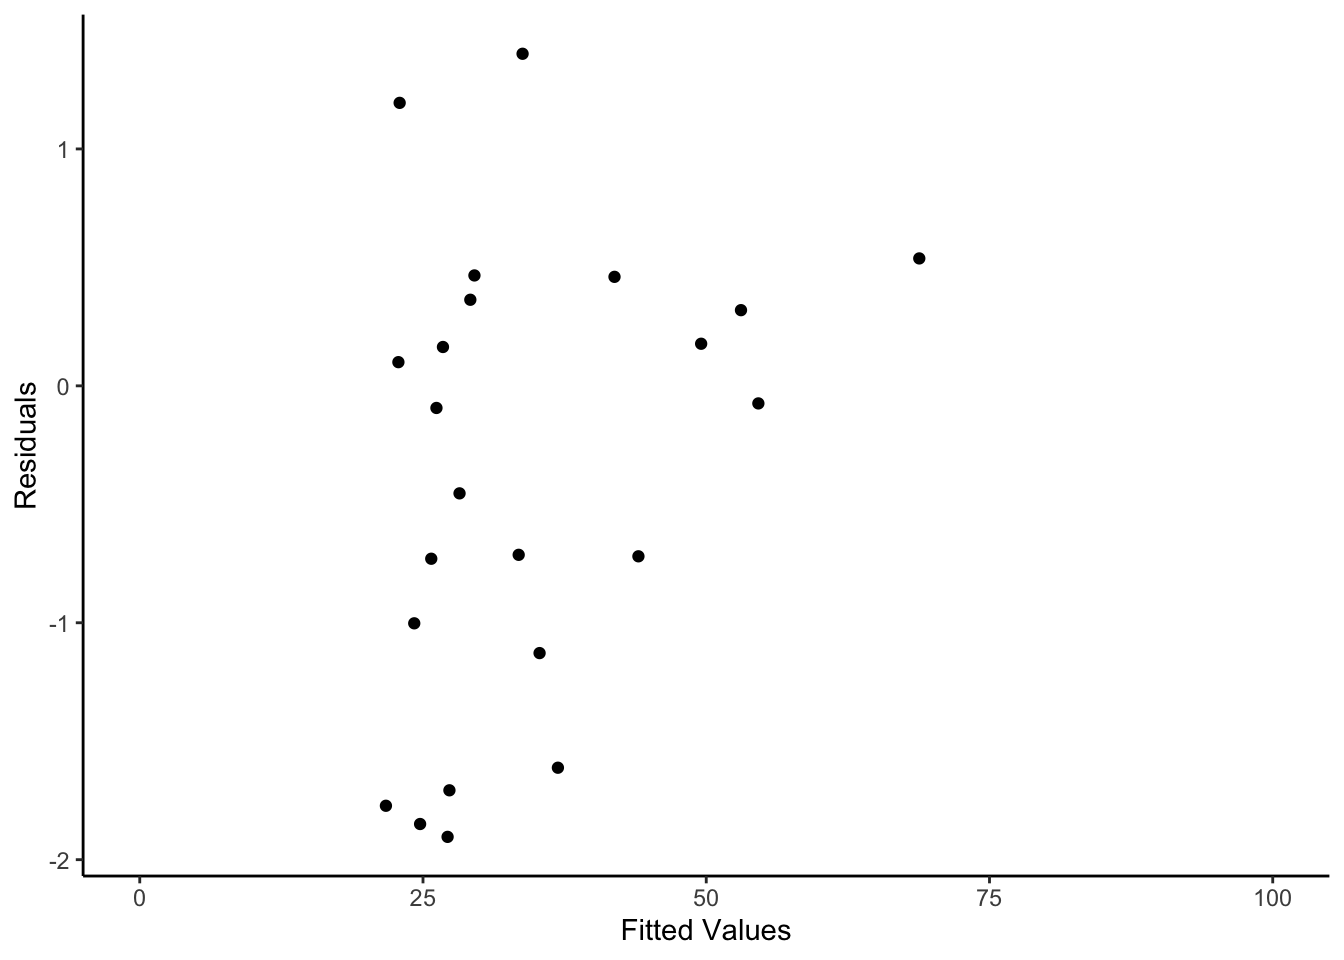
As we can see this is a better residuals check. As mentioned before when we used this data set there are very few data points so we are very unlikely to get a perfect model fit (At least not with a simple glm). We can still see some very large fitted values that might be worth investigating but when we zoom in we can see the other residuals seem pretty good.
Caveats
When dealing with issues of overdispersion there is often discussion of quasi- families. However, they are not true Maximum Likelihood models and will mostly come up with the same results as Negative Binomial.