Gaussian GLMs

Introduction
R
GLMs
Stats
Gaussian
Examples of Gaussian GLMs
Published

September 25, 2023

Using Gaussian GLMs

Linear Model? or General Linear Model with Gaussian Distribution? or ANOVA? or ANCOVA? There are many names for this type of model, they all effectively mean the same thing. I am going to stick to calling it a Gaussian GLM because then there isn’t a new name for every different test. If you don’t like that, use whatever term you like, but the code and interpretation will be the same.

Data Loading - Palmer Penguins

As before lets use the Palmer penguins dataset and remove the NAs (as before NAs should never be remove without considering why there are NAs but here we will remove them for ease).

#install.packages("palmerpenguins")

library(tidyverse)
── Attaching core tidyverse packages ──────────────────────── tidyverse 2.0.0 ──
✔ dplyr     1.1.4     ✔ readr     2.1.5
✔ forcats   1.0.0     ✔ stringr   1.5.1
✔ ggplot2   3.4.4     ✔ tibble    3.2.1
✔ lubridate 1.9.3     ✔ tidyr     1.3.1
✔ purrr     1.0.2     
── Conflicts ────────────────────────────────────────── tidyverse_conflicts() ──
✖ dplyr::filter() masks stats::filter()
✖ dplyr::lag()    masks stats::lag()
ℹ Use the conflicted package (<http://conflicted.r-lib.org/>) to force all conflicts to become errors
library(palmerpenguins)
data(penguins)

penguins_noNAs<-penguins%>% 
  drop_na()

Modelling with Categorical Predictor Variables

So now we will try prove the obvious

Does the flipper length of penguins change between species and between sexes?

Step One - Scienctific Model to Stats Model

Whether we use an interaction or not depends on if our scientific thought believes the relationship of Species to flipper length is different between sexes (sexual dimorphism may not be consistent across species). We shall use an interaction here as we might expect some sexual dimorphism in some species while less, no or opposite sexual dimorphism in other species. If we had good reason to expect the same sexual dimorphism across these species we would not use an interaction term.

Step Two - Resonse Variable Distribution

As you probably guessed from the title we will be using a Gaussian Distribution. However, flipper length would more technically be a Gamma distribution. It is Numeric, Continuous but cannot be Zero or Negative! Using a Gaussian distribution in this situation is okay as flipper length will not approach 0, so issues of modelling near the zero will not be a problem. This is due to our sampling and just the fact that you won’t ever be able to measure a penguins foot that is 1 mm. or probably less than 25 mm! Our lowest value is 174 in the data. One method could be to centre and scale the flipper_length_mm and model it with a Gamma distribution but this would be a lot of converting back and forth, especially when a Gaussian model will perform equally as well.

Step Three - Organising Fixed Effects

Thankfully both sex and species are already factors in the dataset so we don’t have any organising to do!

So lets apply our model. lm() is a function in base r that allows us to create a Gaussian GLM object. There is also a glm() function where we would need to define the distribution but lm() is easier to use for gaussian models. We will create a model object then we can inspect and use this model.

lm2.1<-lm(flipper_length_mm~species*sex,data=penguins_noNAs)

Step Four - Assessing Model Functioning

We could apply a linear model to almost all data but often it will not meet our assumptions.

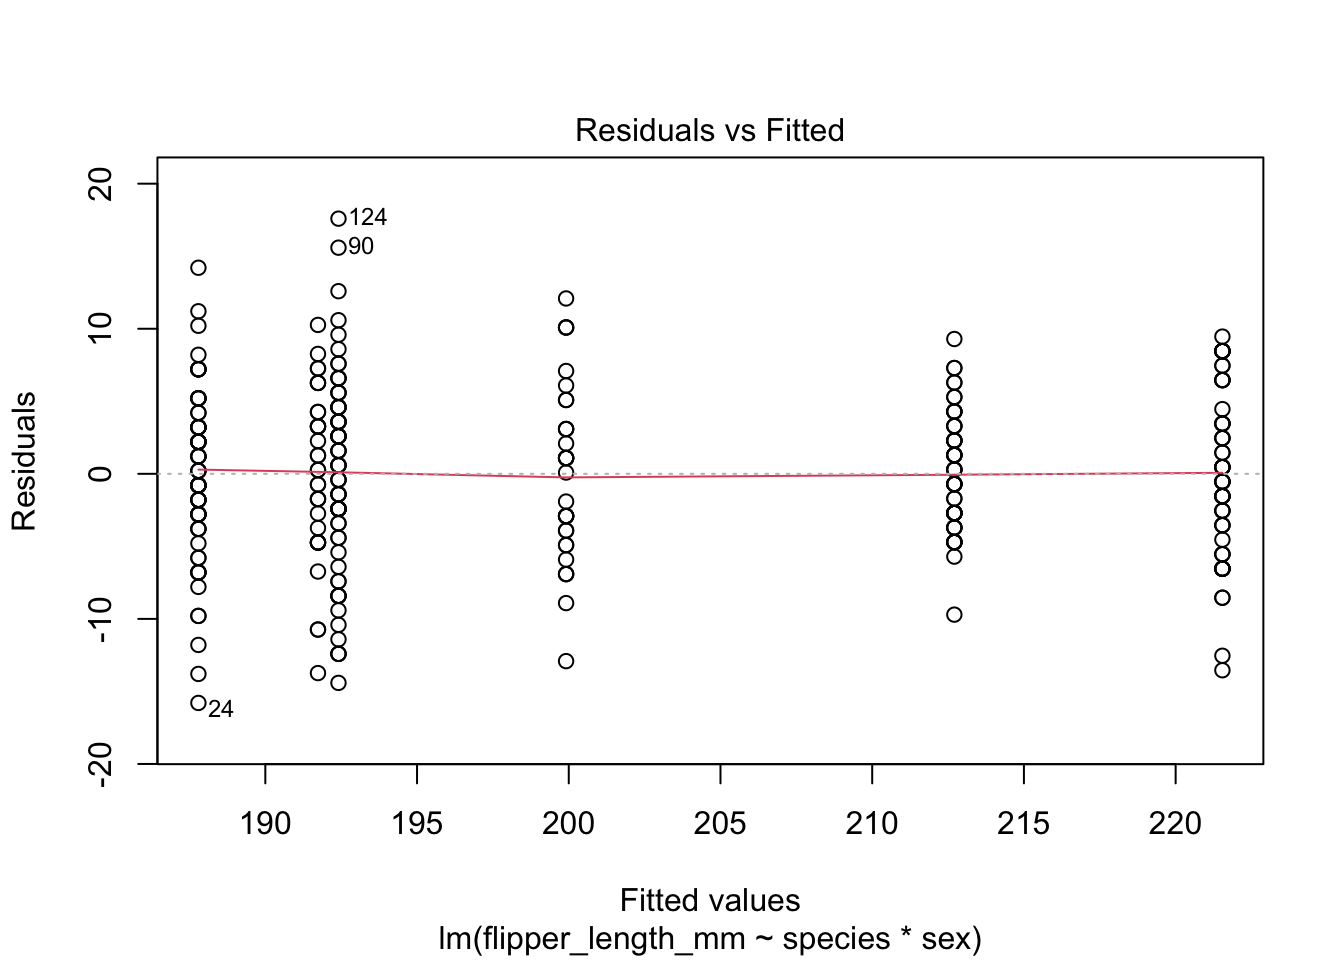
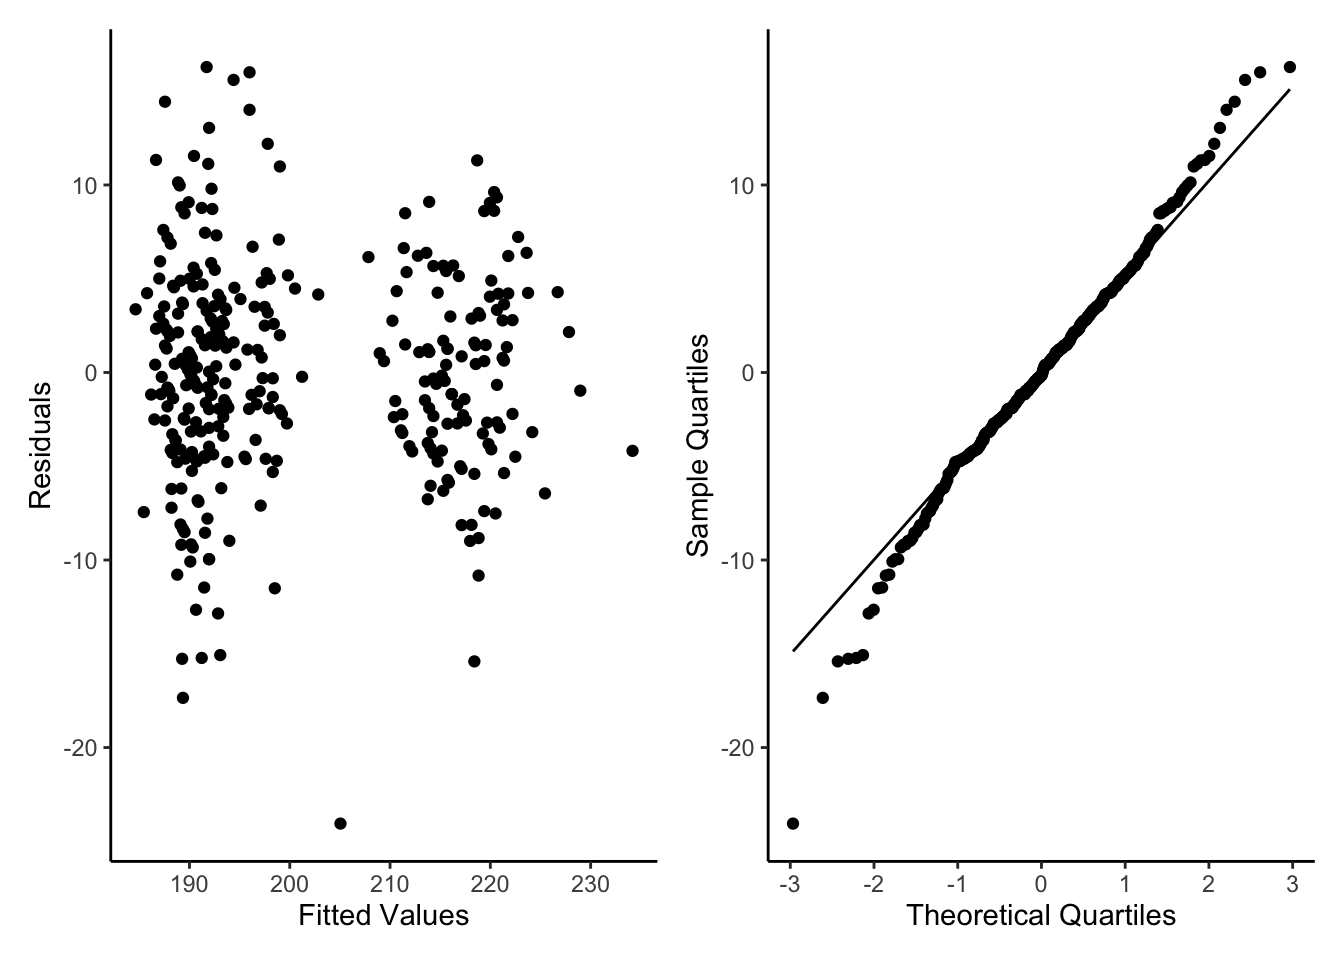
We can now check visually the residuals from our model.

By using the base plot function in 4 we get 4 plots. The first two are the ones we are most interested in generally. The next two plots are less important generally but can be used to find out what is wrong if the first two plots are not as we want them.

For the Residuals vs Fitted plot we want the data to be evenly spread from right to left, meaning the difference between the model and the data (residuals) are not generally larger or smaller at higher or lower values of the model.

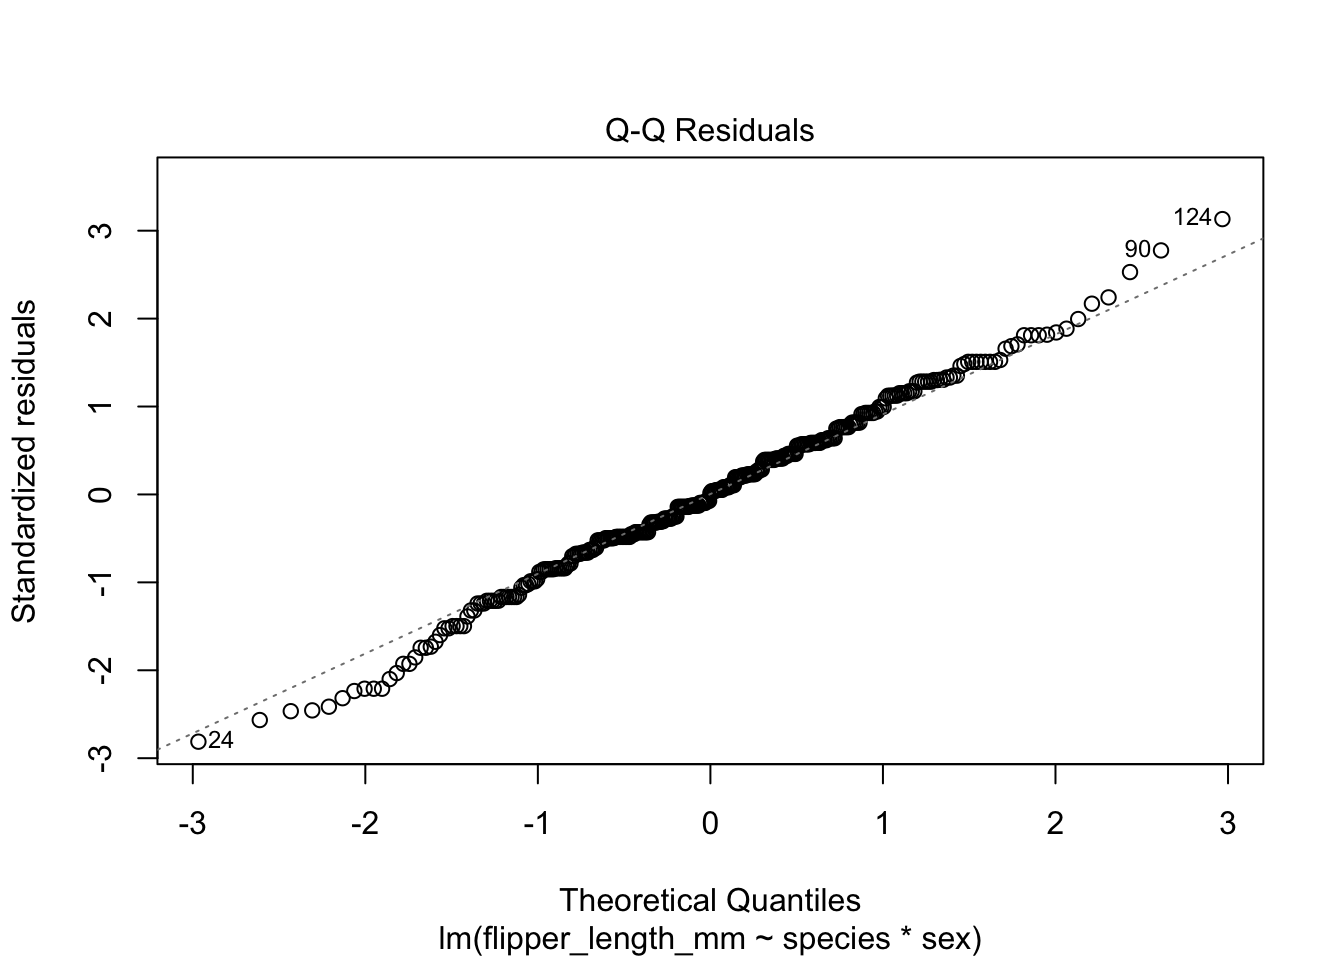
The next important plot is the qq plot, this is best if the points follow line of x=y, which is the dotted line behind the points.

plot(lm2.1)

This is annoying as we have to press enter in the console to see all the plots.

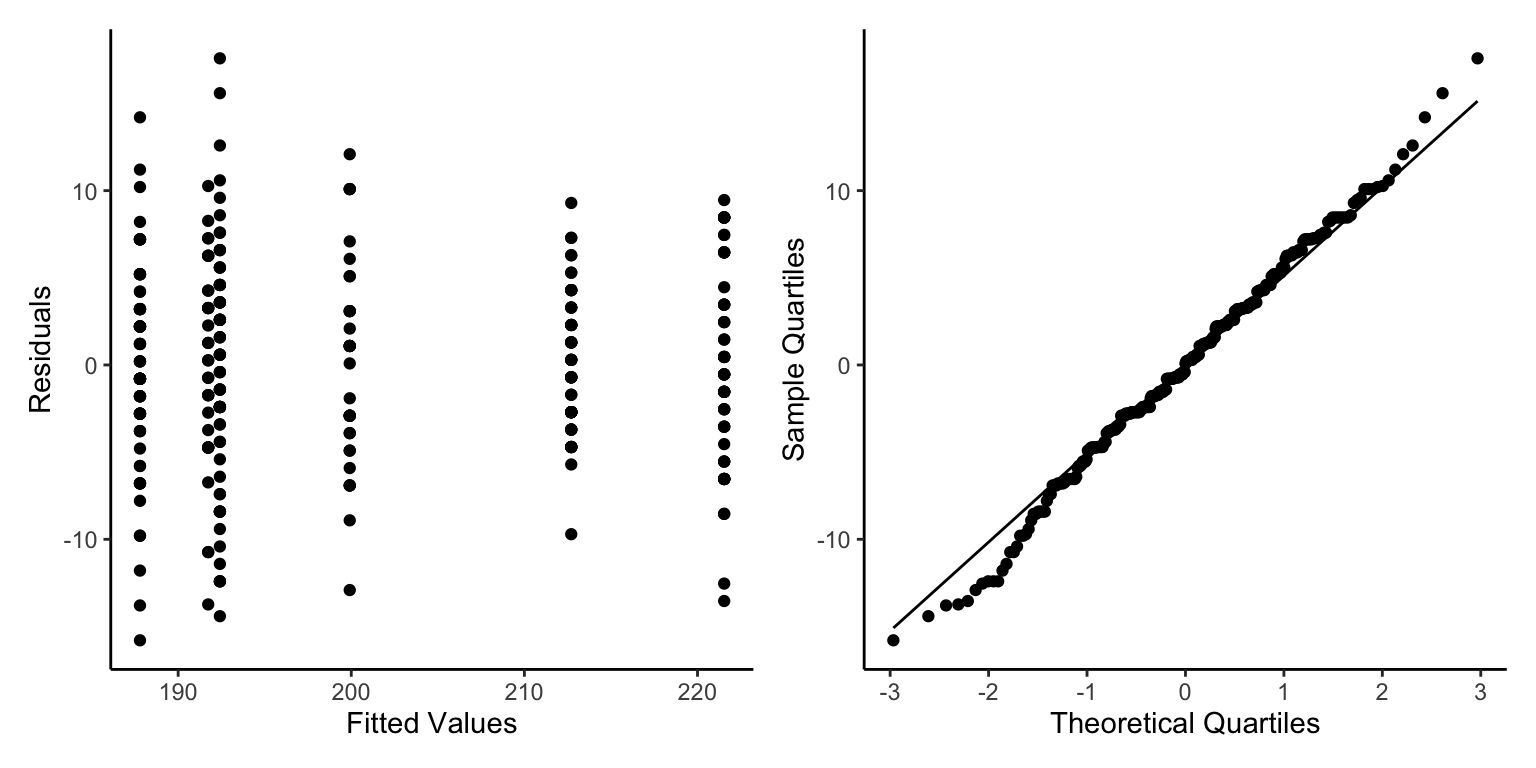
We will code the residuals and qqnorm plots. This is relatively simple code, there are helper functions such as part of the performance package but they are quite unstable from my experience.

#install.packages("patchwork")

library(patchwork)

ModelOutputs<-data.frame(Fitted=fitted(lm2.1),
                  Residuals=resid(lm2.1))

p3<-ggplot(ModelOutputs)+
    geom_point(aes(x=Fitted,y=Residuals))+
    theme_classic()+
    labs(y="Residuals",x="Fitted Values")

p4<-ggplot(ModelOutputs) +
    stat_qq(aes(sample=Residuals))+
    stat_qq_line(aes(sample=Residuals))+
    theme_classic()+
    labs(y="Sample Quartiles",x="Theoretical Quartiles")


p3+p4

As we only have factors in our model we don’t see a ‘cloud’ of points, but the residuals are evenly spread above and below 0 so this is good.

As the diagnostics are good we can look at the results

summary(lm2.1)

Call:
lm(formula = flipper_length_mm ~ species * sex, data = penguins_noNAs)

Residuals:
     Min       1Q   Median       3Q      Max 
-15.7945  -3.4110   0.0882   3.4590  17.5890 

Coefficients:
                         Estimate Std. Error t value Pr(>|t|)    
(Intercept)              187.7945     0.6619 283.721  < 2e-16 ***
speciesChinstrap           3.9408     1.1742   3.356 0.000884 ***
speciesGentoo             24.9124     0.9947  25.044  < 2e-16 ***
sexmale                    4.6164     0.9361   4.932  1.3e-06 ***
speciesChinstrap:sexmale   3.5600     1.6606   2.144 0.032782 *  
speciesGentoo:sexmale      4.2176     1.3971   3.019 0.002737 ** 
---
Signif. codes:  0 '***' 0.001 '**' 0.01 '*' 0.05 '.' 0.1 ' ' 1

Residual standard error: 5.655 on 327 degrees of freedom
Multiple R-squared:  0.8396,    Adjusted R-squared:  0.8372 
F-statistic: 342.4 on 5 and 327 DF,  p-value: < 2.2e-16

Okay there are a lot of numbers here but what does it actually mean?

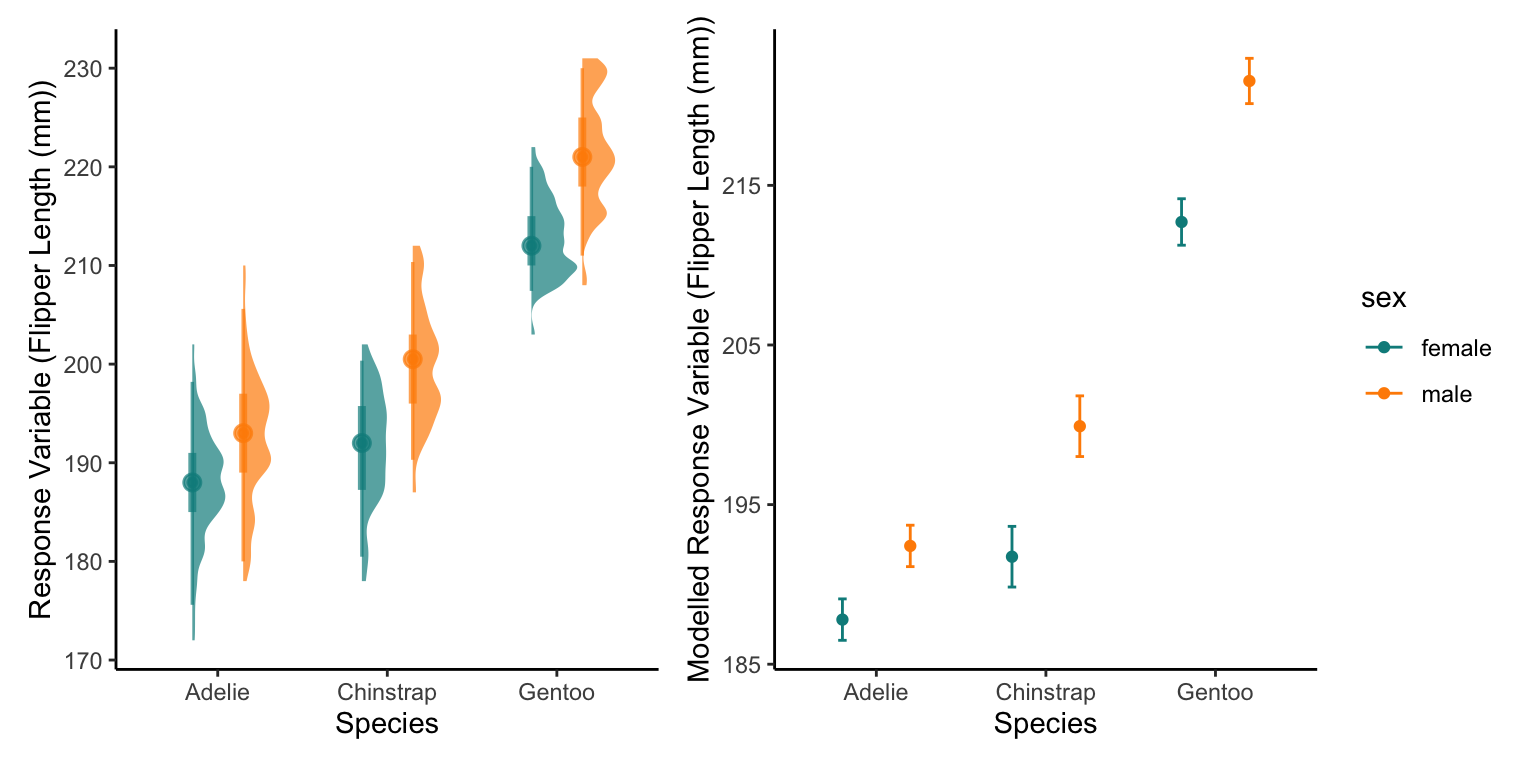
I find the best way to interpret a model output is to plot the model results.

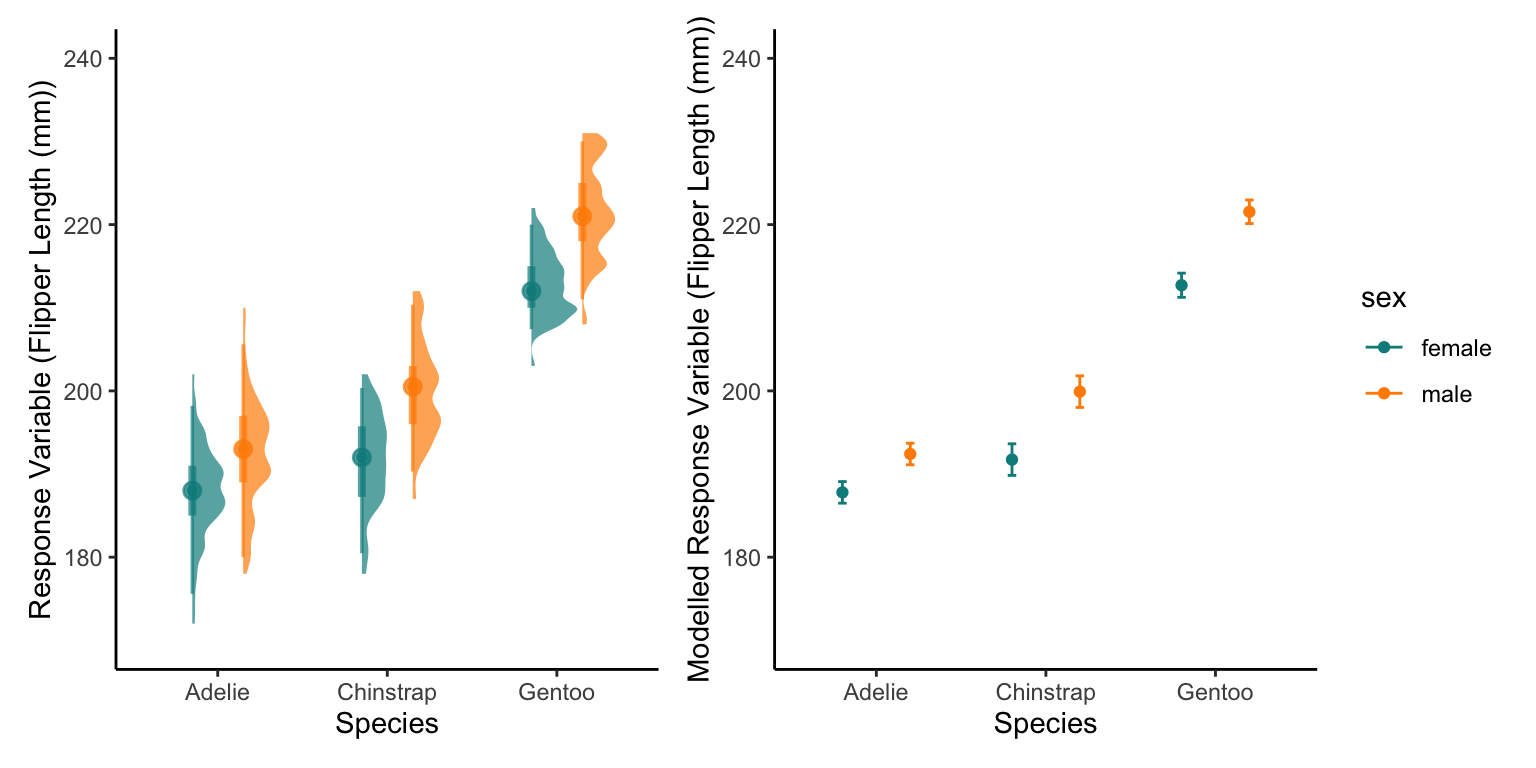
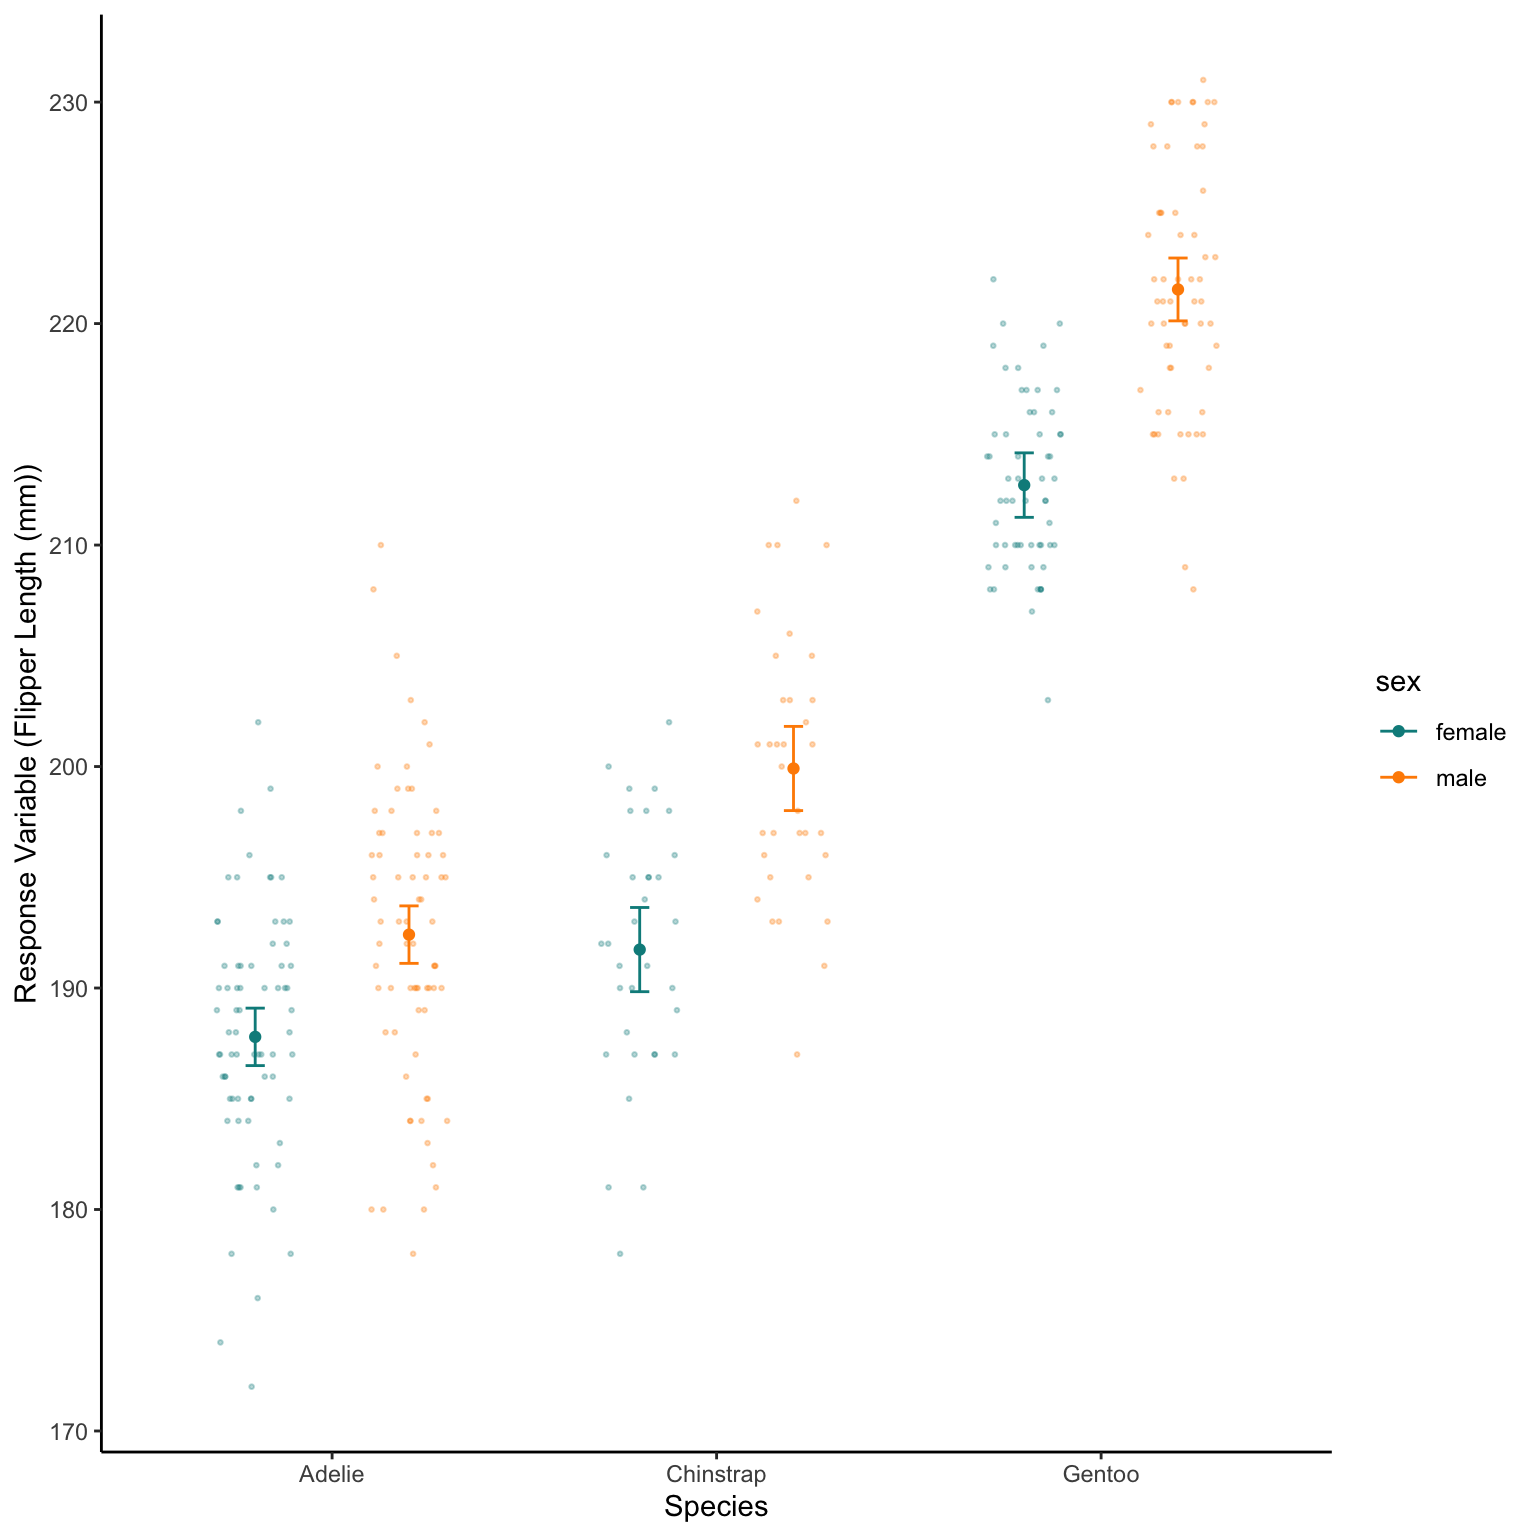
First lets re-plot the raw data, boxplots are probably the best for categorical factors but we could also use a half eye distribution plot. Lets look at both.

The best way to do this (in my opinion) is using the patchwork package that can combine the plots

We create a plot for each, then plot them side by side. Patchwork is a very simple way of combining ggplots together.

We can re-use some of our code from the intro for appearance and colours

#install.packages("ggdist")
library(ggdist)

p_box<-ggplot(penguins_noNAs)+
  geom_boxplot(aes(x=species,
                   y=flipper_length_mm,
                   fill=sex))+
  scale_fill_manual(values=c("darkcyan","darkorange"))+
  labs(x="Species",y="Response Variable (Flipper Length (mm))")+
  theme_classic()

p_cloud<-ggplot(penguins_noNAs,
                aes(x=species,
                    y=flipper_length_mm,
                    fill=sex,colour=sex))+ 
  stat_halfeye(adjust = .5,
                       width = .6, 
                       .width = c(.5, .95),
                       alpha=0.7,
                       position = position_dodge()) +
  scale_fill_manual(values=c("darkcyan","darkorange"))+
  scale_colour_manual(values=c("darkcyan","darkorange"))+
  labs(x="Species",y="Response Variable (Flipper Length (mm))")+
  theme_classic()


p_box+p_cloud

Now we can also see what the model believes about our data

The model has estimated parameters of a linear model.

If we wanted to we could write out our model as this:

\[FlipperLength = Gaussian(y',\sigma)\]

\[y'=y\]

\[ \begin{aligned} y = \beta_{1} sex(female-male):species(Adelie-Chinstrap) \\ + \\ \beta_{2} sex(female-male):species(Adelie-Gentoo) \\ + \\ \beta_{3} sex(female-male) \\ + \\ \beta_{4} species(Adelie-Chinstrap) \\ + \\ \beta_{5} species(Adelie-Gentoo) + Intercept \end{aligned} \]

As the Gaussian distribution has no data restrictions for the mean value the link function is nothing. Seems silly to include here, and many people wouldn’t, but it will keep consistency for later when we do have a link function.

When we plot the estimates into this equation, this should be similar to our raw data but not identical. Remember we are creating a model to Generalise the patterns of the raw data, not copy them!

Step Five - Model Interpretation

Thankfully we don’t have to extract each \(\beta\) parameter from the summary table as R has useful functions that can do this for us! To do this we make simulated raw data with the same predictor variables in.

We then use the model to predict() the response variable based on those predictor variables.

Therefore, we make a data set with just sex and species the same as our original data (be careful of spelling and capitalisation, R wants it identical).

The model then predicts the average Flipper length in mm based on those species and sexes.

We can also tell the predict function to predict error (Standard Error here that we then convert to an approximation of the 95% confidence interval)

NewData_1<-expand.grid(sex=c("female","male"),
                     species=c("Adelie","Chinstrap","Gentoo"))

Pred<-predict(lm2.1,NewData_1,se.fit=TRUE)

NewData<-NewData_1 %>% 
  mutate(response=Pred$fit,
         se.fit=Pred$se.fit,
         Upr=response+(se.fit*1.96),
         Lwr=response-(se.fit*1.96))

ggplot(NewData)+
  geom_point(aes(x=species,
                 y=response,
                 colour=sex),
             position=position_dodge(0.8))+
  geom_errorbar(aes(x=species,
                    ymax=Upr,
                    ymin=Lwr,
                    colour=sex),
                width=0.1,
                position=position_dodge(0.8))+
  scale_colour_manual(values=c("darkcyan","darkorange"))+
  labs(x="Species",y="Response Variable (Flipper Length (mm))")+
  theme_classic()

Lets look at both of these plots next to each other,

First we save both the raw data boxplot as one object and the predicted plot as another then we plot them side by side

Plot1<-ggplot(penguins_noNAs,
                aes(x=species,
                    y=flipper_length_mm,
                    fill=sex,
                    colour=sex))+ 
  ggdist::stat_halfeye(adjust = .5,
                       width = .6, 
                       .width = c(.5, .95),
                       alpha=0.7,
                       position = position_dodge()) +
  scale_fill_manual(values=c("darkcyan","darkorange"))+
  scale_colour_manual(values=c("darkcyan","darkorange"))+
  labs(x="Species",y="Response Variable (Flipper Length (mm))")+
  theme_classic()+
  theme(legend.position = "none")

Plot2<-ggplot(NewData)+
  geom_point(aes(x=species,y=response,colour=sex),
             position=position_dodge(0.8))+
  geom_errorbar(aes(x=species,ymax=Upr,
                    ymin=Lwr,colour=sex),
                width=0.1,
                position=position_dodge(0.8))+
  scale_colour_manual(values=c("darkcyan","darkorange"))+
  labs(x="Species",y="Modelled Response Variable (Flipper Length (mm))")+
  theme_classic()

Plot1+Plot2

At first look this is quite good, but maybe some polishing is needed, mostly the y axis range

There are multiple ways to change this for example setting them both to the same range with scale_y_continuous()

Plot1<-ggplot(penguins_noNAs,
                aes(x=species,
                    y=flipper_length_mm,
                    fill=sex,colour=sex))+ 
  ggdist::stat_halfeye(adjust = .5,
                       width = .6, 
                       .width = c(.5, .95),
                       alpha=0.7,
                       position = position_dodge()) +
  scale_fill_manual(values=c("darkcyan","darkorange"))+
  scale_colour_manual(values=c("darkcyan","darkorange"))+
  labs(x="Species",y="Response Variable (Flipper Length (mm))")+
  theme_classic()+
  scale_y_continuous(limits=c(170,240))+
  theme(legend.position = "none")

Plot2<-ggplot(NewData)+
  geom_point(aes(x=species,y=response,colour=sex),
             position=position_dodge(0.8))+
  geom_errorbar(aes(x=species,ymax=Upr,
                    ymin=Lwr,colour=sex),
                width=0.1,
                position=position_dodge(0.8))+
  scale_colour_manual(values=c("darkcyan","darkorange"))+
  labs(x="Species",y="Modelled Response Variable (Flipper Length (mm))")+
    scale_y_continuous(limits=c(170,240))+
  theme_classic()

Plot1+Plot2

This is better, although we could actually plot both the modelled and raw data on one plot.

We can use a position=position_jitterdodge() to have the raw data not all in one line above their species

ggplot(NewData)+
  geom_point(aes(x=species,y=response,colour=sex),
             position=position_dodge(0.8))+
  geom_errorbar(aes(x=species,ymax=Upr,
                    ymin=Lwr,colour=sex),
                width=0.1,
                position=position_dodge(0.8))+
  geom_point(data=penguins_noNAs,aes(x=species,
                                      y=flipper_length_mm,
                                      colour=sex),
                position=position_jitterdodge(jitter.width = 0.4,
                                              dodge.width = 0.8),
              alpha=0.3,
             size=0.5)+
  scale_colour_manual(values=c("darkcyan","darkorange"))+
  labs(x="Species",y="Response Variable (Flipper Length (mm))")+
  theme_classic()

Modelling Continuous Predictor Variables

Okay that is what we do with linear models of categorical factors.

But what if we want to see the relationship between flipper_length_mm and bill_length_mm.

Step one - Scienctific Model to Stats Model

We know there are species differences and sexual differences in flipper length.

As males always tend to be larger lets just assess species differences in their flipper to bill relationship.

flipper_length_mm~species*bill_length_mm

Lets plot the raw data first

ggplot(penguins_noNAs)+
  geom_point(aes(x=bill_length_mm,y=flipper_length_mm,colour=species))+
  scale_colour_manual(values=c("darkcyan","darkorange","grey30"))+
  labs(x="Bill Length (mm)",y="Flipper Length (mm)")+
  theme_classic()

We can see from the raw data that we will expect to find some interesting relationships

Step Two - Resonse Variable Distribution

Nothing has changed from above, so lets stick to Gaussian

Step Three - Organising Fixed Effects

The fixed effects again need little to no prep so lets apply the model.

lm3.1<-lm(flipper_length_mm~species*bill_length_mm,data=penguins_noNAs)

Step Four - Assessing Model Functioning

Lets check the plots and then the model summary.

ModelOutputs<-data.frame(Fitted=fitted(lm3.1),
                  Residuals=resid(lm3.1))

p3<-ggplot(ModelOutputs)+
    geom_point(aes(x=Fitted,y=Residuals))+
    theme_classic()+
    labs(y="Residuals",x="Fitted Values")

p4<-ggplot(ModelOutputs) +
    stat_qq(aes(sample=Residuals))+
    stat_qq_line(aes(sample=Residuals))+
    theme_classic()+
    labs(y="Sample Quartiles",x="Theoretical Quartiles")


p3+p4

summary(lm3.1)

Call:
lm(formula = flipper_length_mm ~ species * bill_length_mm, data = penguins_noNAs)

Residuals:
     Min       1Q   Median       3Q      Max 
-24.0561  -3.2927  -0.1646   3.5212  16.2890 

Coefficients:
                                Estimate Std. Error t value Pr(>|t|)    
(Intercept)                     158.5047     7.0383  22.520  < 2e-16 ***
speciesChinstrap                -11.8689    12.5448  -0.946   0.3448    
speciesGentoo                    -8.2555    10.8008  -0.764   0.4452    
bill_length_mm                    0.8139     0.1809   4.500 9.46e-06 ***
speciesChinstrap:bill_length_mm   0.1934     0.2788   0.694   0.4884    
speciesGentoo:bill_length_mm      0.5943     0.2495   2.382   0.0178 *  
---
Signif. codes:  0 '***' 0.001 '**' 0.01 '*' 0.05 '.' 0.1 ' ' 1

Residual standard error: 5.799 on 327 degrees of freedom
Multiple R-squared:  0.8314,    Adjusted R-squared:  0.8288 
F-statistic: 322.5 on 5 and 327 DF,  p-value: < 2.2e-16

As we hypothesised before modelling that there would be different bill to flipper relationships between species

The interaction model follows our scientific assumptions.

Therefore, it would be incorrect to use lower complexity models (without the interaction for example)

Step Five - Model Interpretation

To predict again we want to create lines for each species.

To do this we want to create fake bill length data over the same range for each species

Here we will use the seq() function again that creates a sequence of values from your first number to your last number

And you can chose the length of the vector it creates or the distance between each individual value

NewData_<-expand.grid(bill_length_mm=seq(from=min(penguins_noNAs$bill_length_mm),
                                        to=max(penguins_noNAs$bill_length_mm),
                                        length.out=1000),
                     species=c("Adelie","Chinstrap","Gentoo"))

As the different species won’t be across all of these bill length ranges

We should also remove values outside of each species range

There would be many ways to do it, here we will use multiple dplyr functions together

This is where having the pip function helps keep the order of functions that are applied clear

First we create a df for each Species with their max and min bill lengths

Then we use case_when (a more sophisticated version of if_else()) to create a new column in our new df that either says Good or it will have NAs

We then filter all rows that have NAs in them, thus removing bill lengths outside of each species’ range.

Gentoo_Range<-penguins_noNAs %>% 
  filter(species=="Gentoo") %>% 
  summarise(min=min(bill_length_mm),
            max=max(bill_length_mm))

Adelie_Range<-penguins_noNAs %>% 
  filter(species=="Adelie") %>% 
  summarise(min=min(bill_length_mm),
            max=max(bill_length_mm))

Chinstrap_Range<-penguins_noNAs %>% 
  filter(species=="Chinstrap") %>% 
  summarise(min=min(bill_length_mm),
            max=max(bill_length_mm))


NewData_3<-NewData_ %>% 
  mutate(Range=case_when(species=="Gentoo" &
                              bill_length_mm>=Gentoo_Range$min &
                              bill_length_mm<=Gentoo_Range$max~"Good",
                         species=="Adelie" &
                           bill_length_mm>=Adelie_Range$min &
                           bill_length_mm<=Adelie_Range$max~"Good",
                         species=="Chinstrap" &
                           bill_length_mm>=Chinstrap_Range$min &
                           bill_length_mm<=Chinstrap_Range$max~"Good"
  )) %>% 
  filter(!Range%in%NA) %>% 
  select(-Range)

After bad range values are filtered out we use the select function to remove the “Range” column, we do this with the - operator.

Pred_2<-predict(lm3.1,NewData_3,se.fit=TRUE)

NewData_2<-NewData_3 %>% 
  mutate(response=Pred_2$fit,
         se.fit=Pred_2$se.fit,
         Upr=response+(se.fit*1.96),
         Lwr=response-(se.fit*1.96))

So now we have many data points that can be used to draw the linear model outputs

ggplot()+
  geom_ribbon(data=NewData_2,mapping=aes(x=bill_length_mm,ymax=Upr,
                                                 ymin=Lwr,fill=species),
              alpha=0.4)+
  geom_line(data=NewData_2,mapping=aes(x=bill_length_mm,y=response,colour=species),
             alpha=0.4)+
  scale_color_manual(values=c("darkcyan","darkorange","grey30"))+
  scale_fill_manual(values=c("darkcyan","darkorange","grey30"))+
  labs(x="Bill Length (mm)",y="Response Variable (Flipper Length (mm))")+
  theme_classic()

This looks good but lets maybe add the raw data values onto the same figure as the model outputs as before

ggplot()+
  geom_point(data=penguins_noNAs,mapping = aes(x=bill_length_mm,
                                               y=flipper_length_mm,
                                               colour=species),
             alpha=0.4,size=0.8)+
  geom_ribbon(data=NewData_2,mapping=aes(x=bill_length_mm,ymax=Upr,
                                         ymin=Lwr,fill=species),
              alpha=0.4)+
  geom_line(data=NewData_2,mapping=aes(x=bill_length_mm,y=response,colour=species),
            alpha=0.4)+
  scale_color_manual(values=c("darkcyan","darkorange","grey30"))+
  scale_fill_manual(values=c("darkcyan","darkorange","grey30"))+
  labs(x="Bill Length (mm)",y="Response Variable (Flipper Length (mm))")+
  theme_classic()