Making Static Maps in R
Introduction
Tidyverse
ggplot2
R
sf
Mapping
GIS
A Rapid Introduction to Mapping in R for Research Scientists: From Reading in Shape files and Rasters to plotting Shape files alongside Rasters in different Projections.
Rant about Research and Being Lazy
Okay so I have strong and potentially controversial opinions on using GIS software. While very useful, user friendly tools, just like Excel, I strongly argue against their use for scientific analysis (I have caveats to this). The main pillars of science, in my opinion, are increasing societies knowledge in an open, repeatable, replicate-able and critique-able way. Therefore, using software that is paid for or not open access is a big no for me. Likewise, software that is just lots of clicking buttons, without a full transcript of the process being carried out, doesn’t allow full repeatablility. This may be repetition by other researchers to check your results, emulate your analysis method on another dataset or it may be repetition by future you or me! Another major element of using a coding language to carry out tasks is scaleability. If I make a map in a GIS software, to make the same map with a few changes will always take a similar amount of time, doing so in r (or another coding language) will decrease the time per map through looping or functional programming. I am also a lazy scientist, I can use R to carry out all elements of my research, so why learn another program? (I do use other languages from time to time actually but still)
Rant Over, Simple Mapping Attack Plan
Spatial Data Types
Spatial data is basically the same as any other data type but it has some information about its location, and generally it is stored in two major types: Raster or Shape. Raster data are gridded with repeating units or pixels, with each pixel having x and y coordinates and some data value(s). Shape data are generally types of irregular polygons or points.
Thankfully for us we can use ggplot2 and its functionality to plot a wide range of shapes and rasters, as well as combinations of them.
Mapping Attack Plan
Step 1 - Background Map
- Sometimes this is all we want and can be many different types: satellite image, coastline, road map. Generally, it gives us the spatial context for other elements we want to display.
Step 2 - Spatially Explicit Details
- Secondly we want the elements we are going to display inside our geographical context, this could be bathymetry, sample sites, labels etc.
Step 3 - Appearance
- Finally, we want to add other info elements like scale bars, north arrows, data sources and generally improve the appearance.
With ggplot we can layer all these elements on top of each other in the order we want.
Map the Globe
Step 1 - Background Map
Here we need the data itself, then we want to plot it in a projection that makes sense for our use. Atlantic centric? Pacific centric? But depending on some projections we may need to do some extra work for it to look nice.
Data Download
Often we will have our own shape or raster files locally, but there are also a wide range of easily accessible data for different forms of data.
In this tutorial we will be using readily available open access data, specifically the rnaturalearth shape files of countries to begin with.
To organise and edit we will use the sf package for shape files and the terra package for rasters. There are many others, such as sp, raster and maptools etc. However, they are being deprecated soon and recommend using sf or terra. There are also many supplements to these packages, when we need them we will install and use them.
World Coastlines
The rnaturalearth packages have preloaded data that we can access for country polygons at different spatial scales, lets look at the middle scale. If we load the basic ne_countries() data set and tell the function we want it as an ‘sf’ object we can plot it using the base plot. However, as there are many columns other than the spatial information the base plot() function plots each separately.
library(tidyverse)
library(sf)
library(rnaturalearth)
library(rnaturalearthdata)
#remotes::install_github("ropensci/rnaturalearthhires")
library(rnaturalearthhires)

world_map <- ne_countries(returnclass = "sf",scale = 50)

plot(world_map)
Warning: plotting the first 9 out of 63 attributes; use max.plot = 63 to plot
all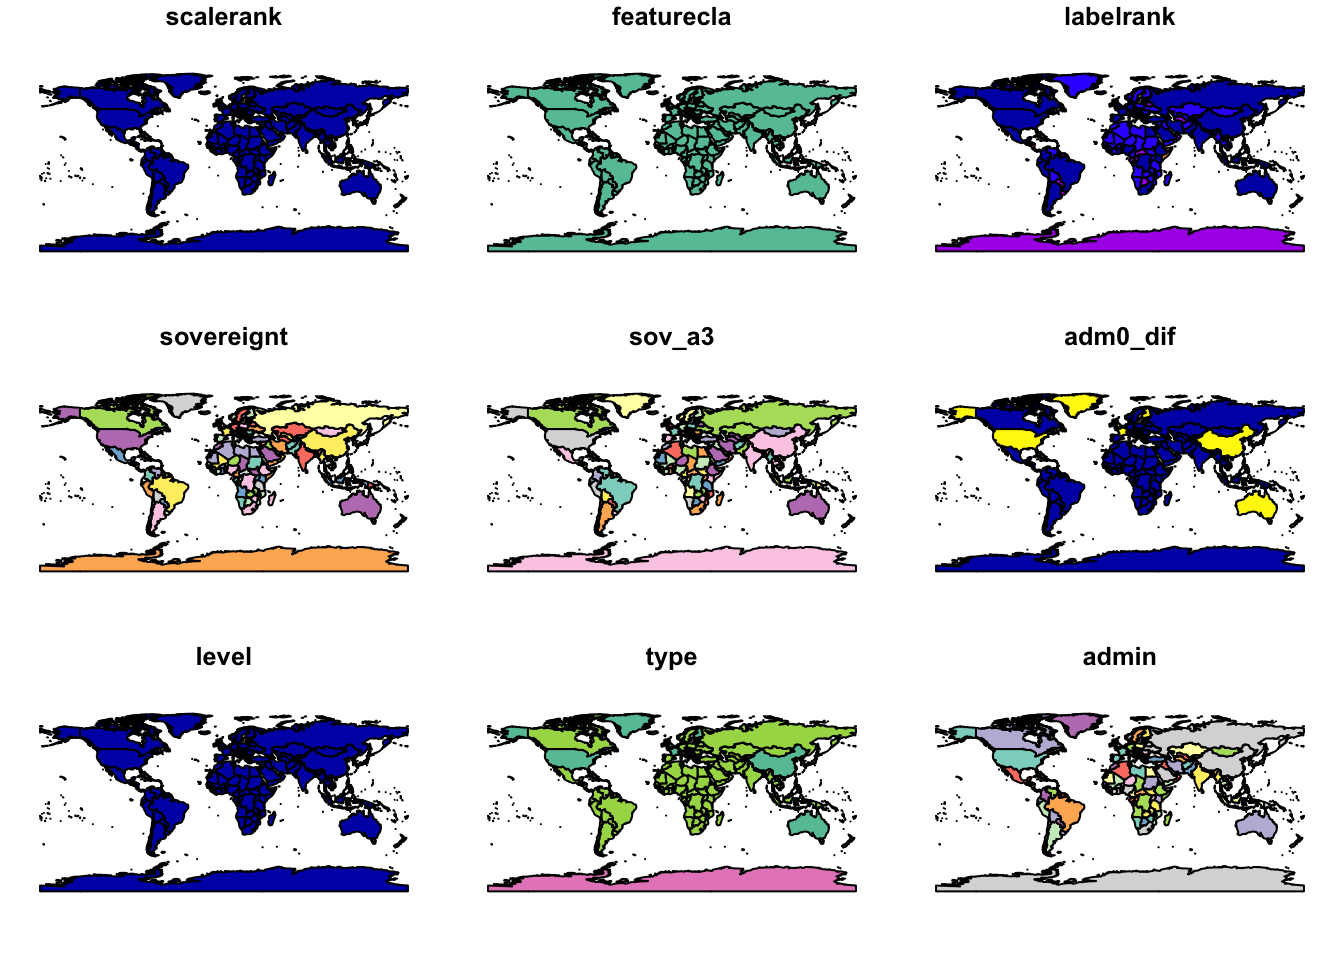
Here we have a world_map object in our global environment, and generally it seems just like a normal dataframe, with columns and rows of data. An sf object has extra information in a column called geometry. This is information on the type of shape (Point, Line or Polygon) for each row in the dataframe. Here we have a row with a polygon or group of polygons for each country, alongside lots of info on its administration and population etc. As a dataframe we can easily inspect the data we have and use the same techniques of data manipulation we have used before such as mutating, selecting, summarising, grouping etc.
Lets take a glance at the top of the first 6 columns:
head(world_map[c(1:6)])Simple feature collection with 6 features and 6 fields
Geometry type: MULTIPOLYGON
Dimension: XY
Bounding box: xmin: -70.06611 ymin: -18.01973 xmax: 74.89131 ymax: 60.40581
Geodetic CRS: +proj=longlat +datum=WGS84 +no_defs +ellps=WGS84 +towgs84=0,0,0
scalerank featurecla labelrank sovereignt sov_a3 adm0_dif
0 3 Admin-0 country 5 Netherlands NL1 1
1 1 Admin-0 country 3 Afghanistan AFG 0
2 1 Admin-0 country 3 Angola AGO 0
3 1 Admin-0 country 6 United Kingdom GB1 1
4 1 Admin-0 country 6 Albania ALB 0
5 3 Admin-0 country 6 Finland FI1 1
geometry
0 MULTIPOLYGON (((-69.89912 1...
1 MULTIPOLYGON (((74.89131 37...
2 MULTIPOLYGON (((14.19082 -5...
3 MULTIPOLYGON (((-63.00122 1...
4 MULTIPOLYGON (((20.06396 42...
5 MULTIPOLYGON (((20.61133 60...Enter ggplot2
Lets plot it using ggplot instead. Thankfully the sf package has its own geom (geom_sf()), this means we don’t have to give it too much information for it to do something pretty good.
ggplot(world_map)+
  geom_sf()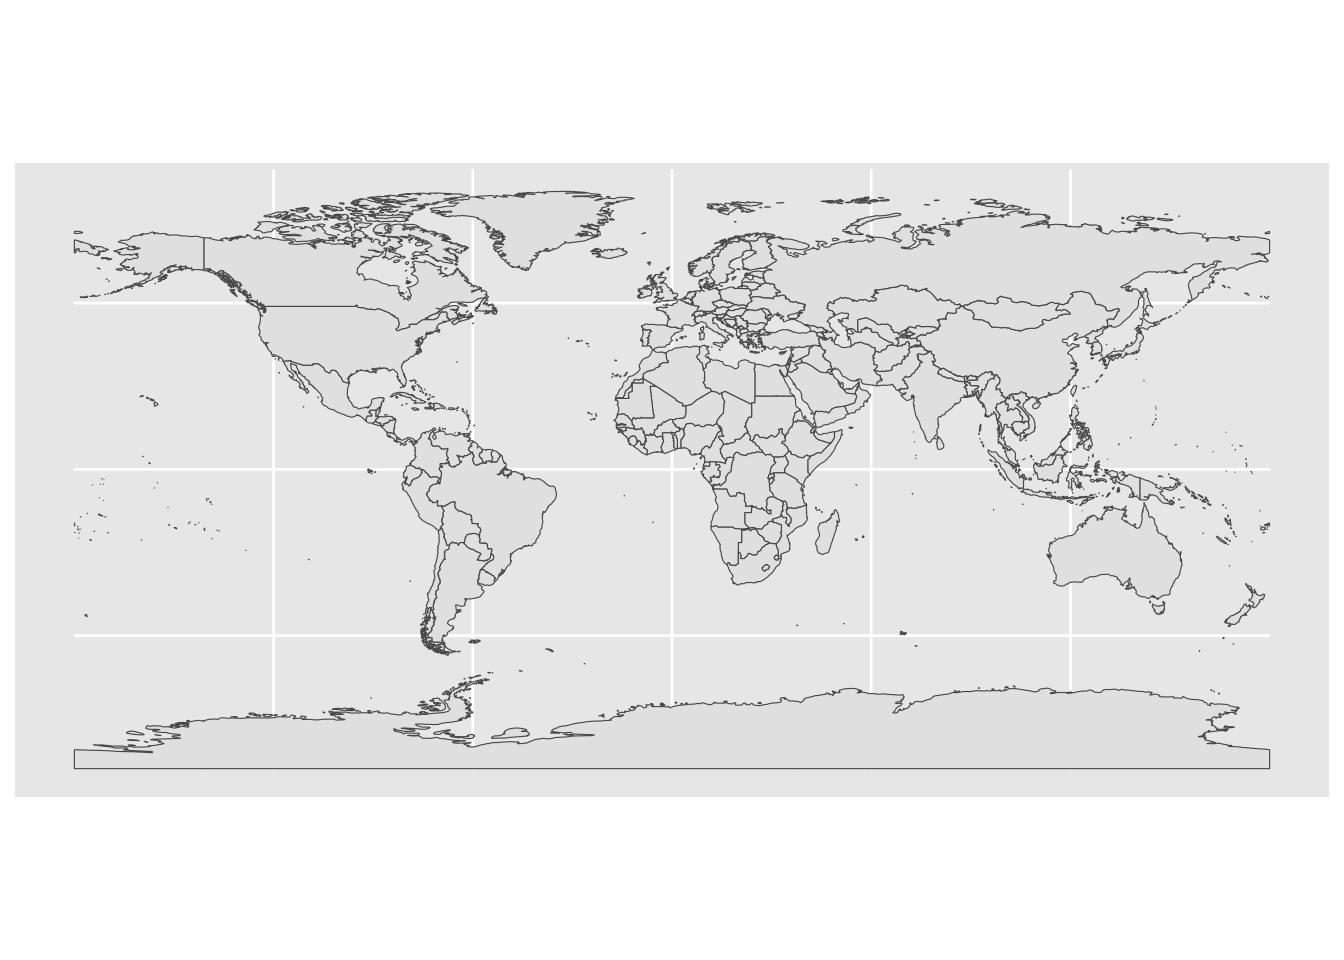
There are some obvious issues with this map but generally it is a pretty good starting point.
Coordinate Reference Systems and Projections
Here we are looking at a map of a three dimensional sphere projected onto a flat surface. To do this we use different map projections, which can lead to interesting effects by distorting apparent size, such as Antarctica being long and thin at the base of this map, when really it is a circle shape around the south pole. We can easily change between CRS using sf functions. While previously CRS was denoted with quite a long string, now there are easy to use 4 digit EPSG codes. You can find loads here: https://spatialreference.org/ref/epsg/
EPSG codes relate to preset or defined CRS strings. So we can use either EPSG codes or we can be more specific with a CRS we want to use e.g.: “+proj=laea +lat_0=0 +lon_0=-30 +x_0=43210000 +y_0=3210000 +ellps=GRS80 +towgs84=0,0,0,0,0,0,0 +units=m +no_defs”. This string states the projection, the centre lat, centre lon, the centre x, centre y, the ellipsoid (type of sphere the globe is assumed to be), the conversion from WGS 84, the units, and other info. For the standard latlong projection that is often used we would have: “+proj=longlat +datum=WGS84 +no_defs”
For example here is the same map reprojected to Mercator:
world_map %>%
st_transform(crs=3857) %>%
ggplot()+
  geom_sf()+
  theme_classic()
But we can see a BIG issue with this projection. It makes greenland look like the size of africa, and it also makes antarctica the size of the sun (not quite)! As it is a ggplot we can crop out the bottom of the graph instead.
world_map %>%
st_transform(crs=3857) %>%
ggplot()+
  geom_sf()+
  coord_sf(ylim = c(-20000000,NA))+
  theme_classic()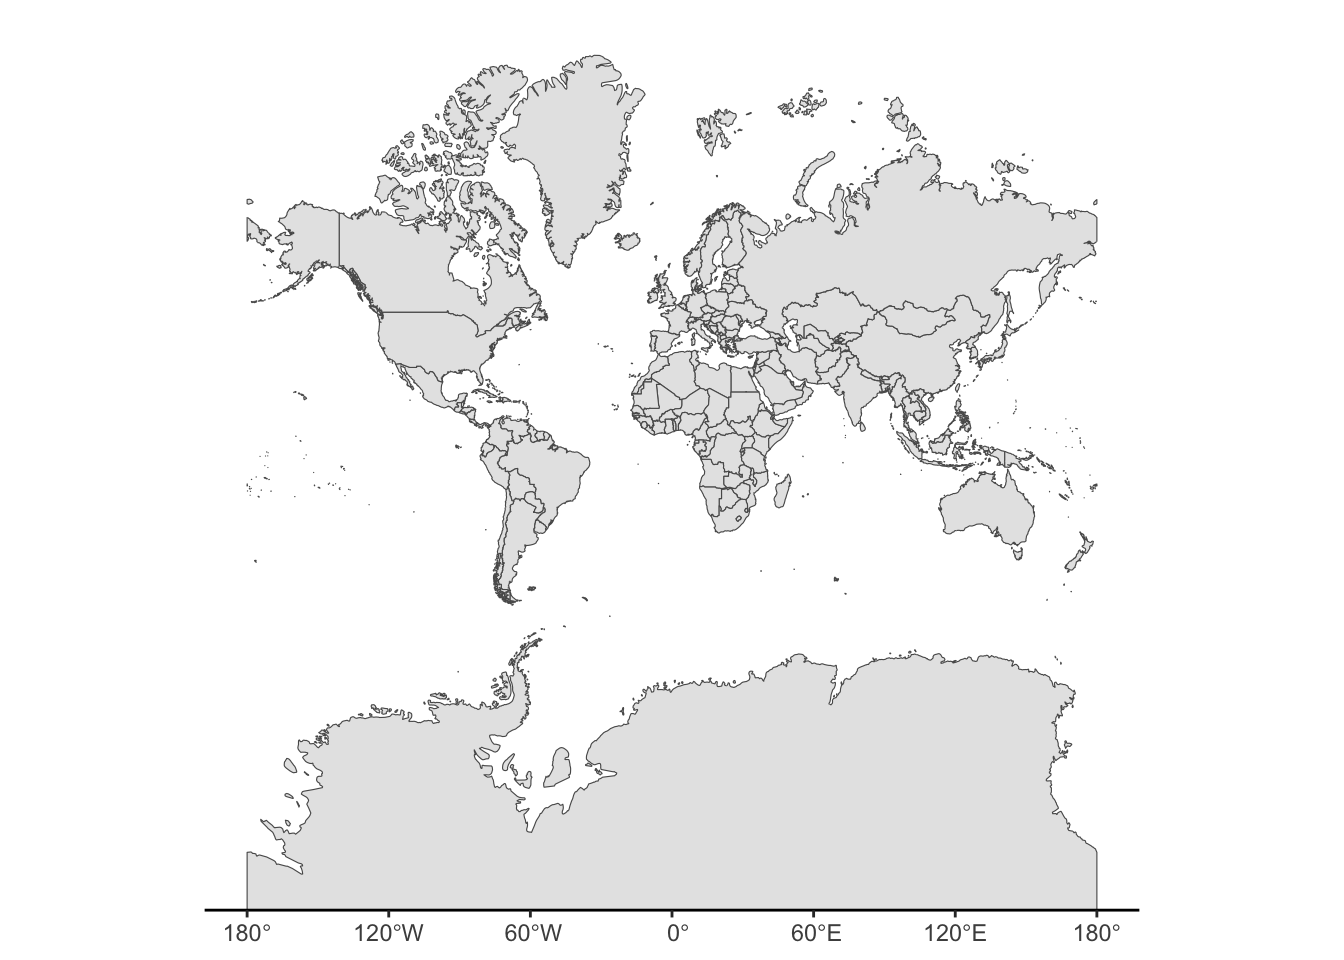
The mercator uses metres as its units so we have to use those units for setting limits. Lets see some other systems.
world_map %>%
st_transform(crs=3978) %>%
ggplot()+
  geom_sf()+
  theme_classic()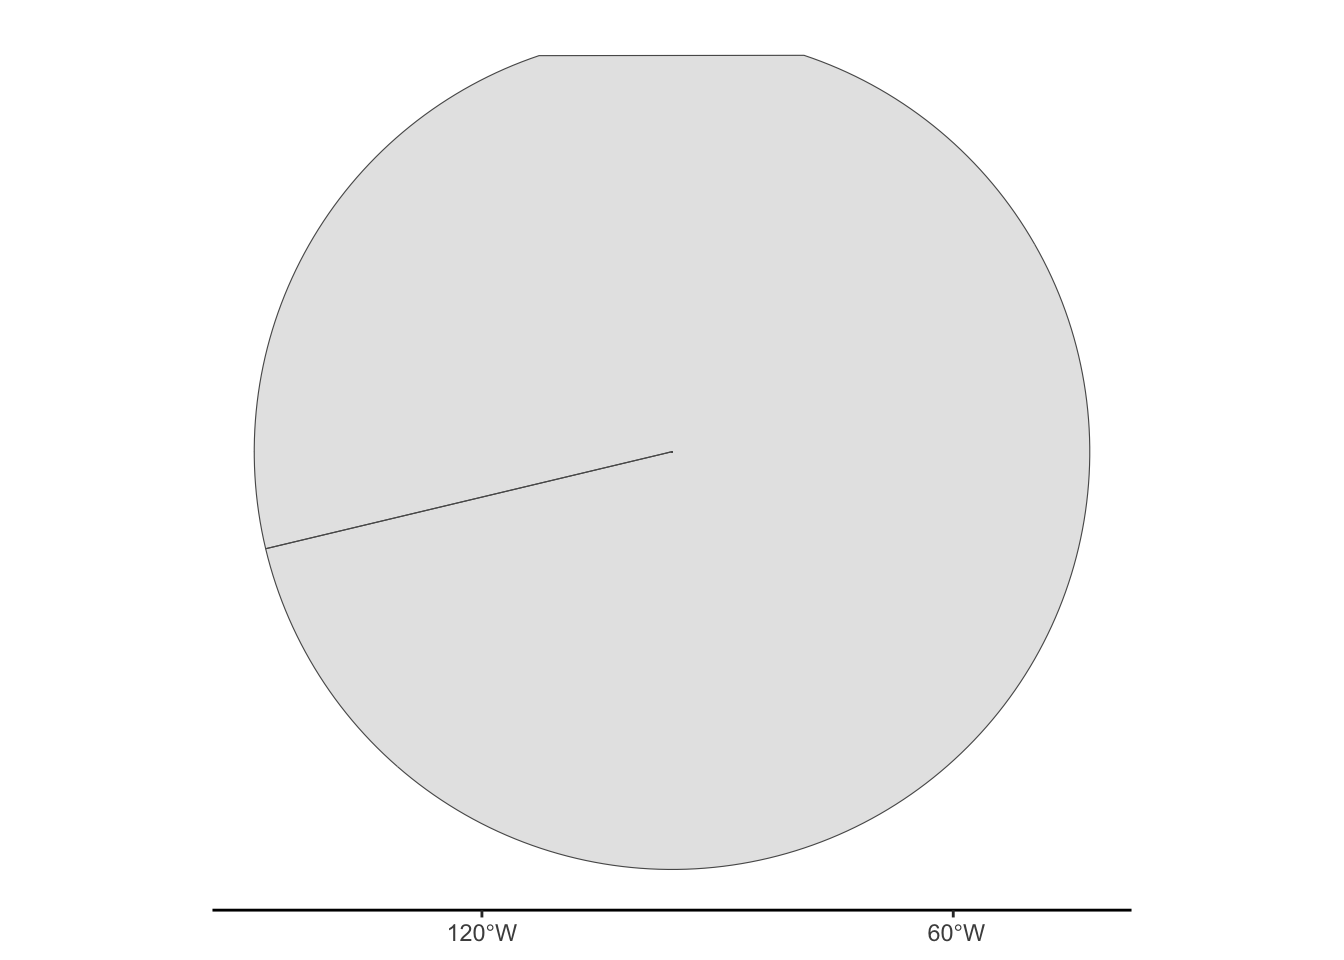
world_map %>%
st_transform(crs=32190) %>%
ggplot()+
  geom_sf()+
  theme_classic()
world_map %>%
st_transform(crs=26917) %>%
ggplot()+
  geom_sf()+
  theme_classic()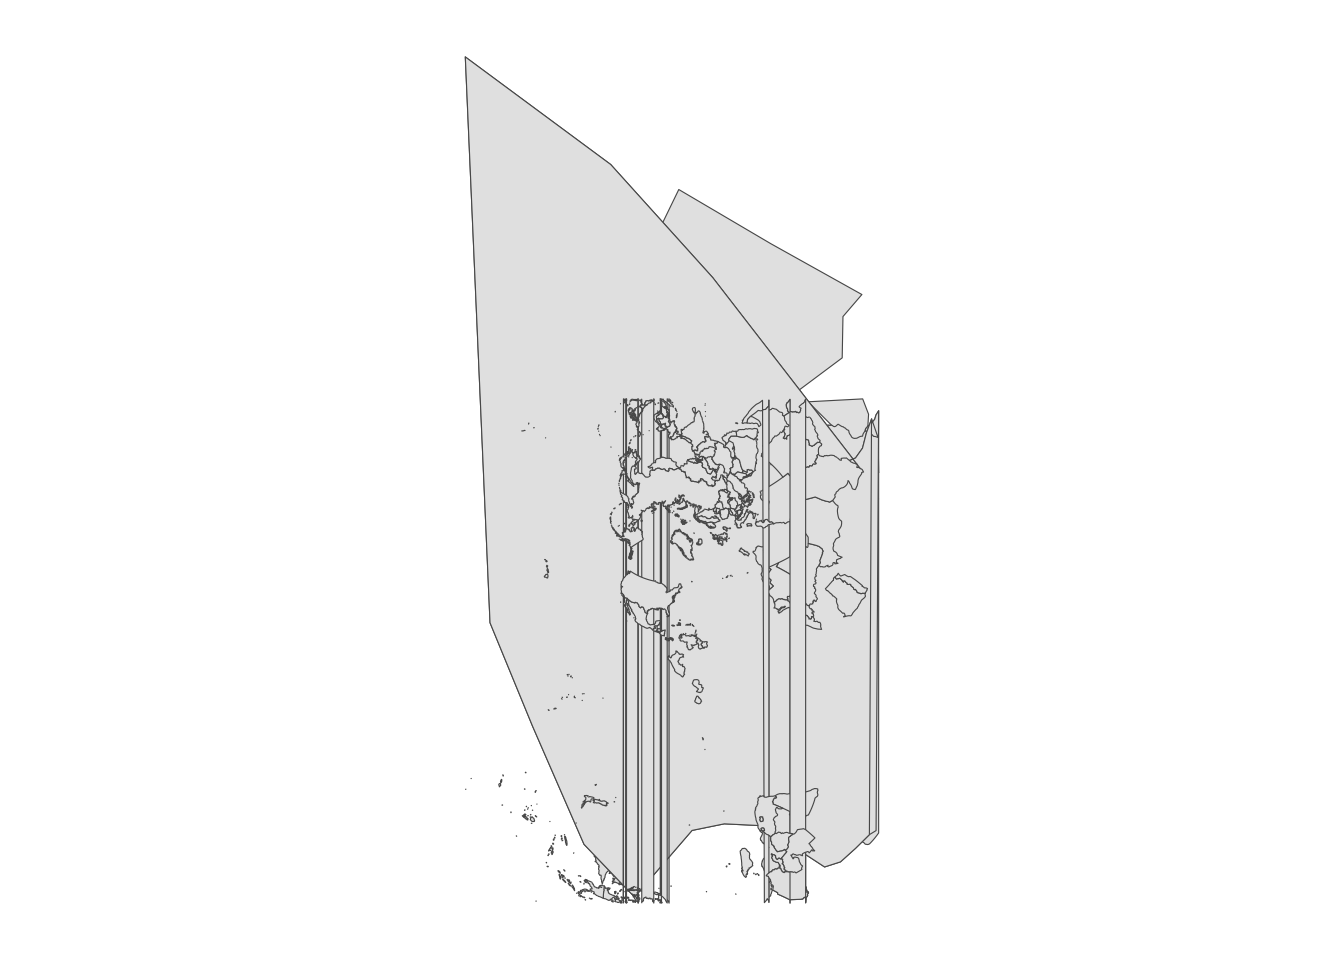
As you can see, all of these are horrible. By reprojecting the sf file we are causing the polygons to become glitchy and distorted. It seems some issue is being caused by Antarctica. Perhaps if we remove it it will look better?
world_map %>%
  filter(!sovereignt=="Antarctica") %>%
st_transform(crs=3978) %>%
ggplot()+
  geom_sf()+
  theme_classic()
Okay no it does not.
Distortions
These projections have inherent edges to their projection (the far left or far right of the plotted map) which will be latitude or longitude values, they will also have the centre position. The areas of the map that are furthest from the centre, around the edges will become distorted when plotting on a 2D plane: think about looking at a 3D globe and trying to see the countries on the other side from you. When transforming and then plotting, a polygon of a country (the shape that country makes) will potentially get divided byt the edge of the projection area. Thus, we get these weird glitchy distortions. There are ways around having these distortions but it involves creating a really thin polygon along the edges of the original map, then deleting this thin polygon. This splits the polygons that will be split when changing the transformation. We can visualise this if we want.
Original Map and transformed into desired CRS.
world_map %>%
st_transform(crs=4326) %>%
ggplot()+
  geom_sf()+
  theme_classic()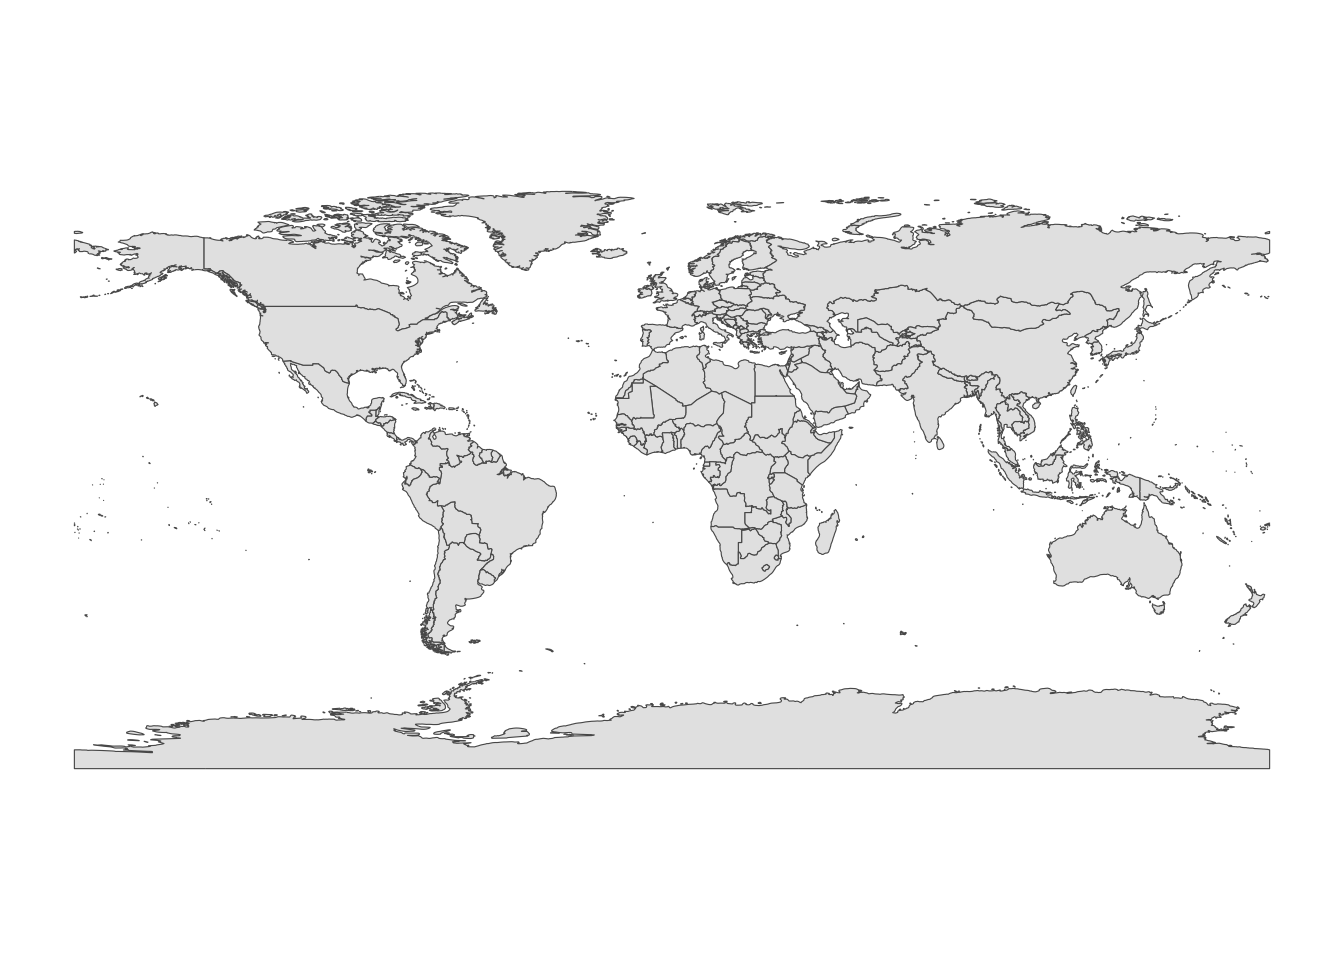
world_map %>%
st_transform(crs=st_crs("+proj=cea +lon_0=130 +x_0=0 +y_0=0 +lat_ts=45 +ellps=WGS84 +datum=WGS84 +units=m +no_defs")) %>%
ggplot()+
  geom_sf()+
  theme_classic()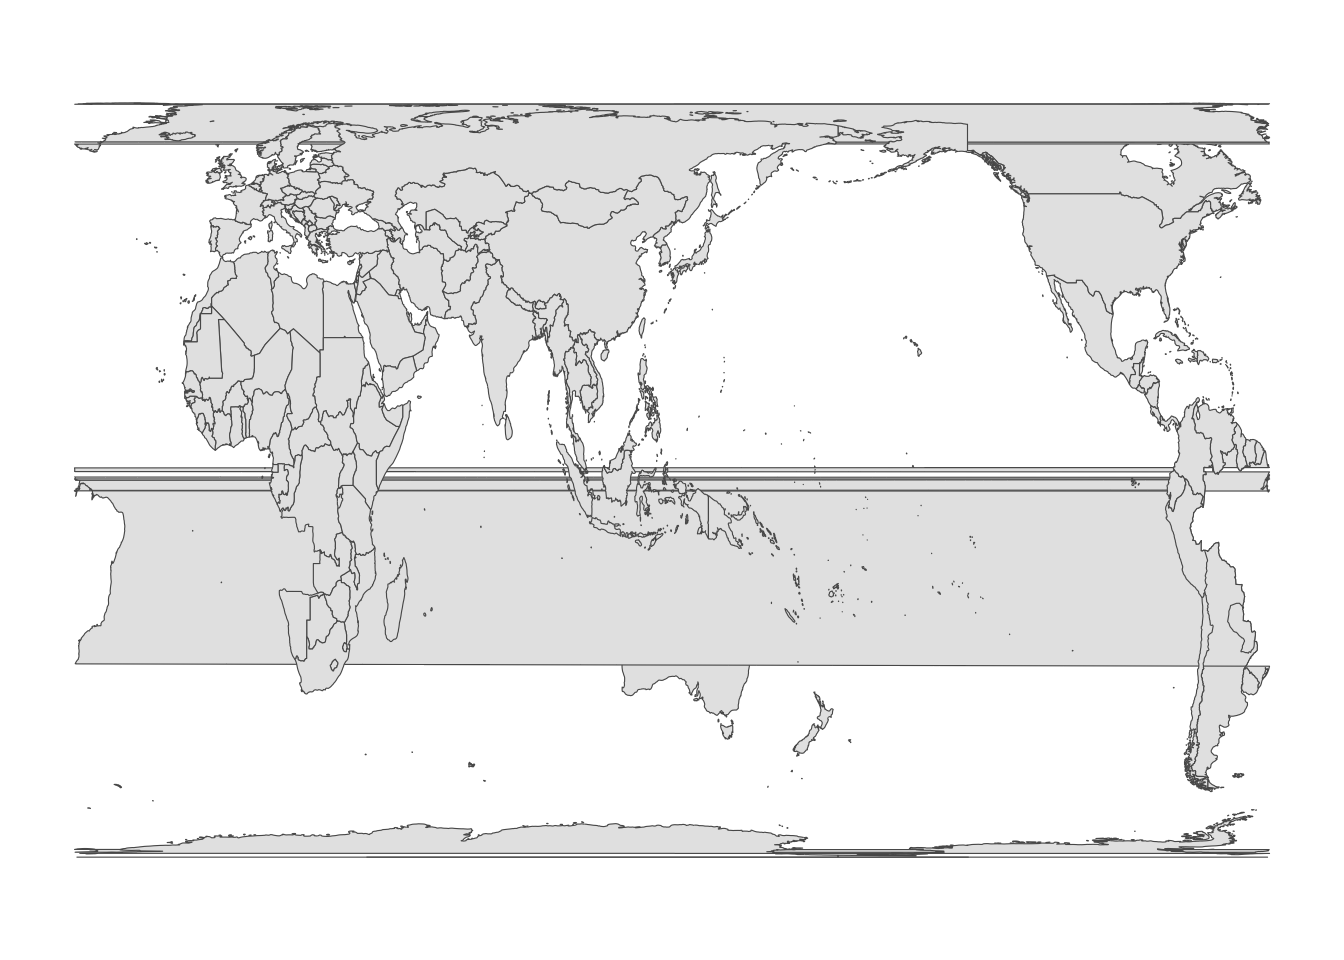
So in our desired projection we can see the the central longitude is 130. We therefore need to make a slim polygon opposite 130 on the globe! (180-130)
world<-world_map %>%
st_transform(crs=4326)%>%
  st_make_valid()


# define a long & slim polygon that overlaps the meridian line & set its CRS to match
# that of world

# Centered in lon 130 on this example

offset <- 180 - 130


polygon <- st_polygon(x = list(rbind(
  c(-0.0001 - offset, 90),
  c(0 - offset, 90),
  c(0 - offset, -90),
  c(-0.0001 - offset, -90),
  c(-0.0001 - offset, 90)
))) %>%
  st_sfc() %>%
  st_set_crs(4326)
Lets plot the slim polygon on the original map.
world_map %>%
st_transform(crs=4326) %>%
ggplot()+
  geom_sf()+
  geom_sf(data=polygon,fill="red",colour="red")+
  theme_classic()
Now we have this thin polygon we can remove this slim area from the original world map.
world_fixed <- world %>%
  st_difference(polygon)

target_crs<-st_crs("+proj=cea +lon_0=130 +x_0=0 +y_0=0 +lat_ts=45 +ellps=WGS84 +datum=WGS84 +units=m +no_defs")

world_fixed <- world_fixed %>%
  st_transform(target_crs)


ggplot(data = world_fixed) +
  geom_sf()+
  theme_classic()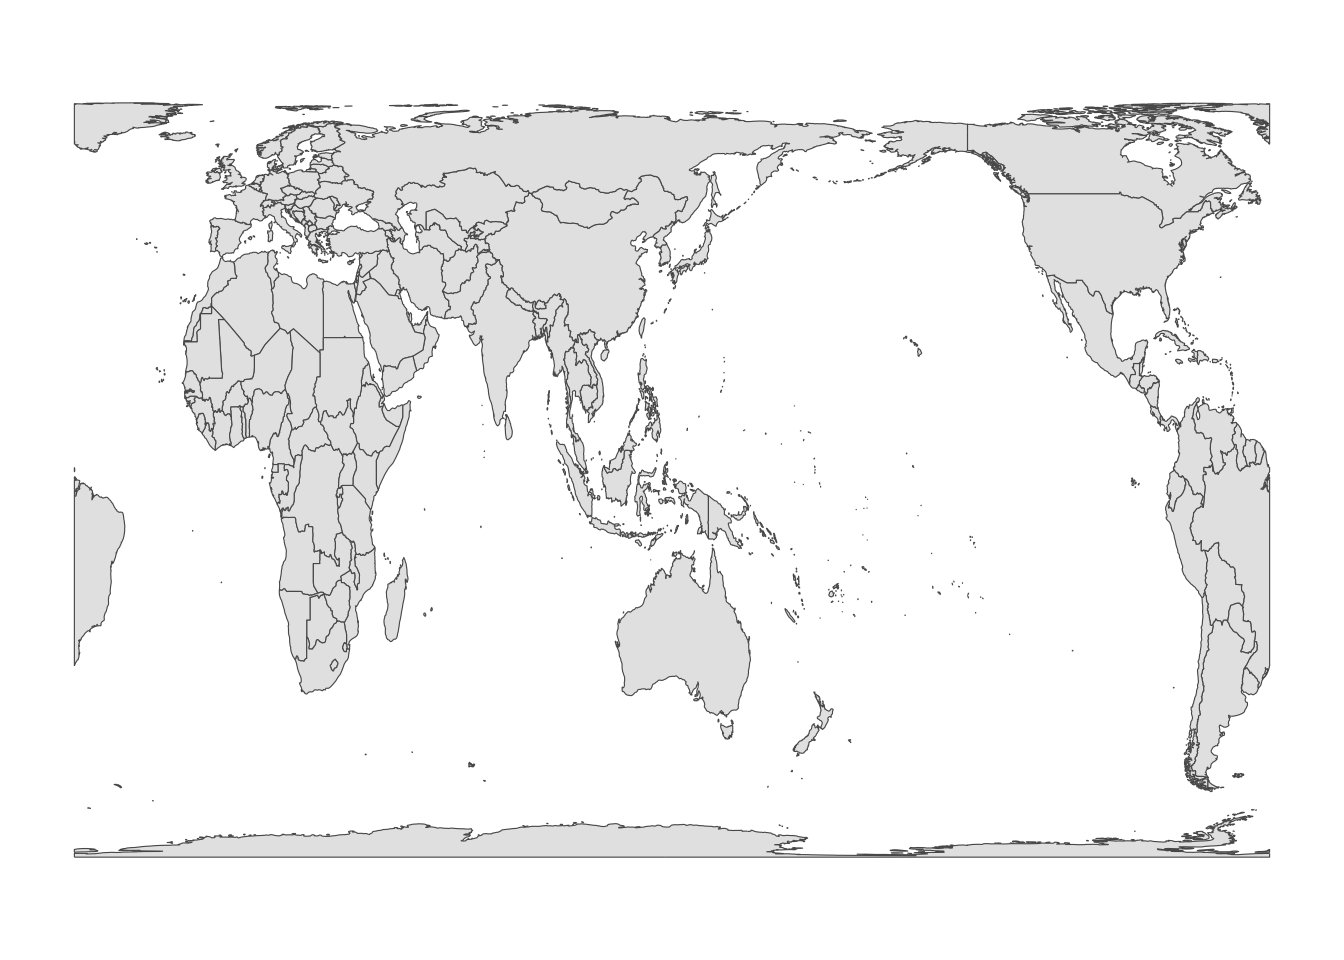
Here there are still some odd looking shapes e.g. Papua New Guinea. Maybe we can find a better projection. Maybe we can use one that looks a little 3D even when in 2D?
world_map %>%
  st_transform("+proj=laea +lat_0=0 +lon_0=-30 +x_0=43210000 +y_0=3210000 +ellps=GRS80 +towgs84=0,0,0,0,0,0,0 +units=m +no_defs") %>%
ggplot()+
  geom_sf()+
  theme_classic()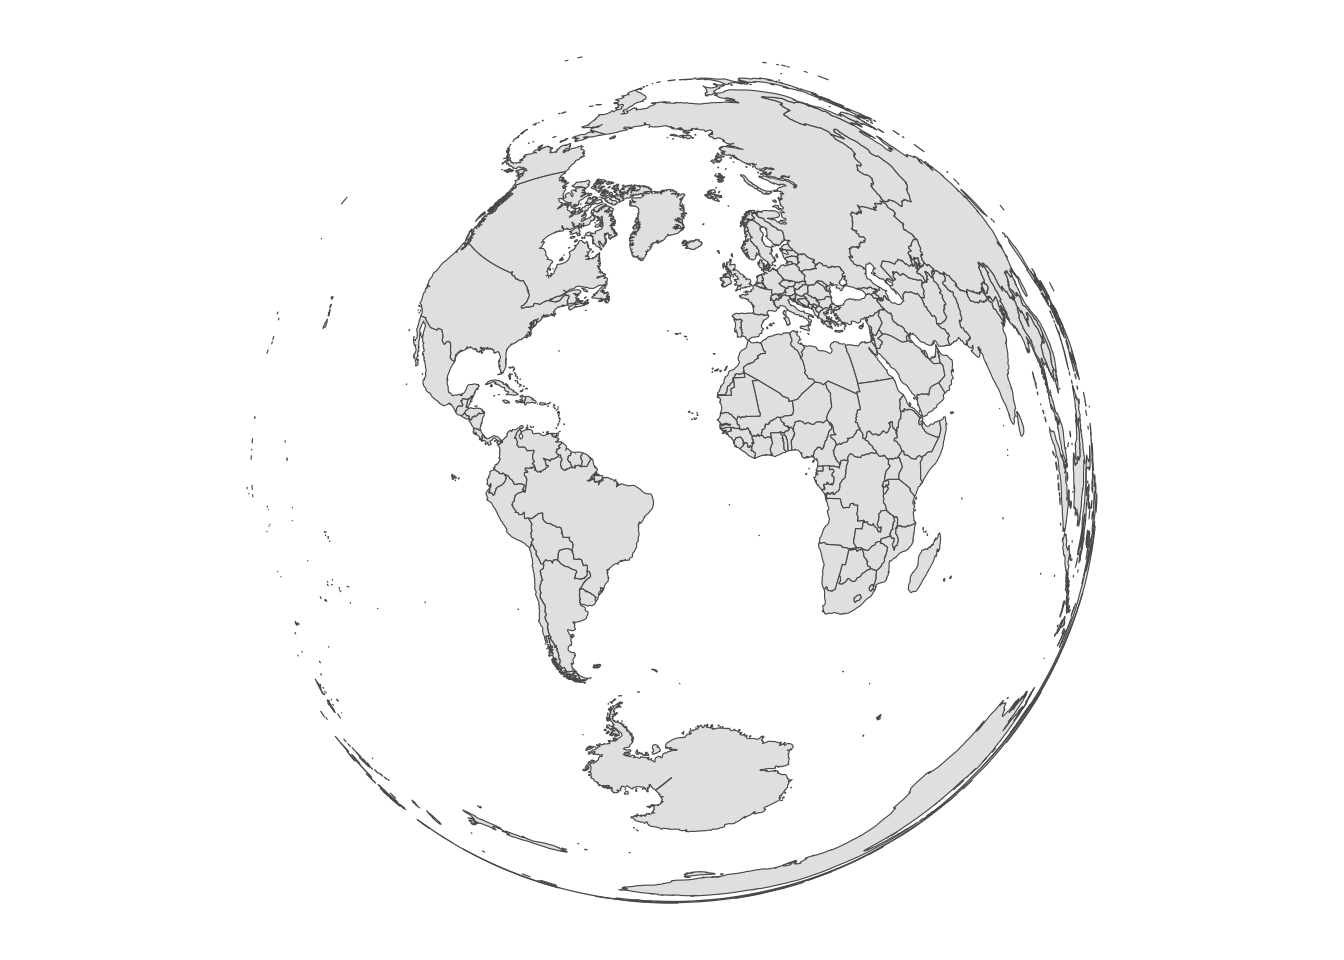
This projection is a favourite of mine, I used it above for the map of Europe. The choice of mapping projection will be dictated by the scale you want to show and on your own personal preference.
Step 2 - Spatially Explicit Details
Okay so we have a global map we will use to be our Base Map, it isn’t perfect by any means but it is fine for now. Now lets plot some spatially explicit data. As a Marine Ecologist with a dark Oceanography past, I absolutely LOVE bathymetry plots so lets get some bathymetry and try make a nice Bathymetry plot of the Atlantic. We may have our own bathymetry data, or we could go to some website, download it and read into r, or we can download straight into r using the marmap package. This gets bathymetry data from the NOAA database. (Or GEBCO if you prefer)
To do this we use the getNOAA.bathy() and tell the function the longitude limits, then latitude limits, then the resolution. If our desired data cross the antimeridian (the longitude line 180 and -180) we can tell the function this too. This function creates a bathy object, but we can convert this to a data frame with as.xyz(). Remember when we set a big area and a fine resolution value the file gets bigger so will take longer to download and to plot. We shall also remove Depth values that are positive so we only get Depth. (This may not be ideal for inland areas that are below 0, such as the eastern coast of the UK).
#install.packages("marmap")

library(marmap)
# Get bathymetric data
bat <- getNOAA.bathy(lon1=-90,lon2=40,lat1=70,lat2=-60, res = 4)
bat_xyz <- as.xyz(bat) %>%
rename(Longitude=V1,Latitude=V2,Depth=V3) %>%
filter(Depth<1)
ggplot(bat_xyz)+
geom_tile(aes(x=Longitude,y=Latitude,fill=Depth))+
theme_classic()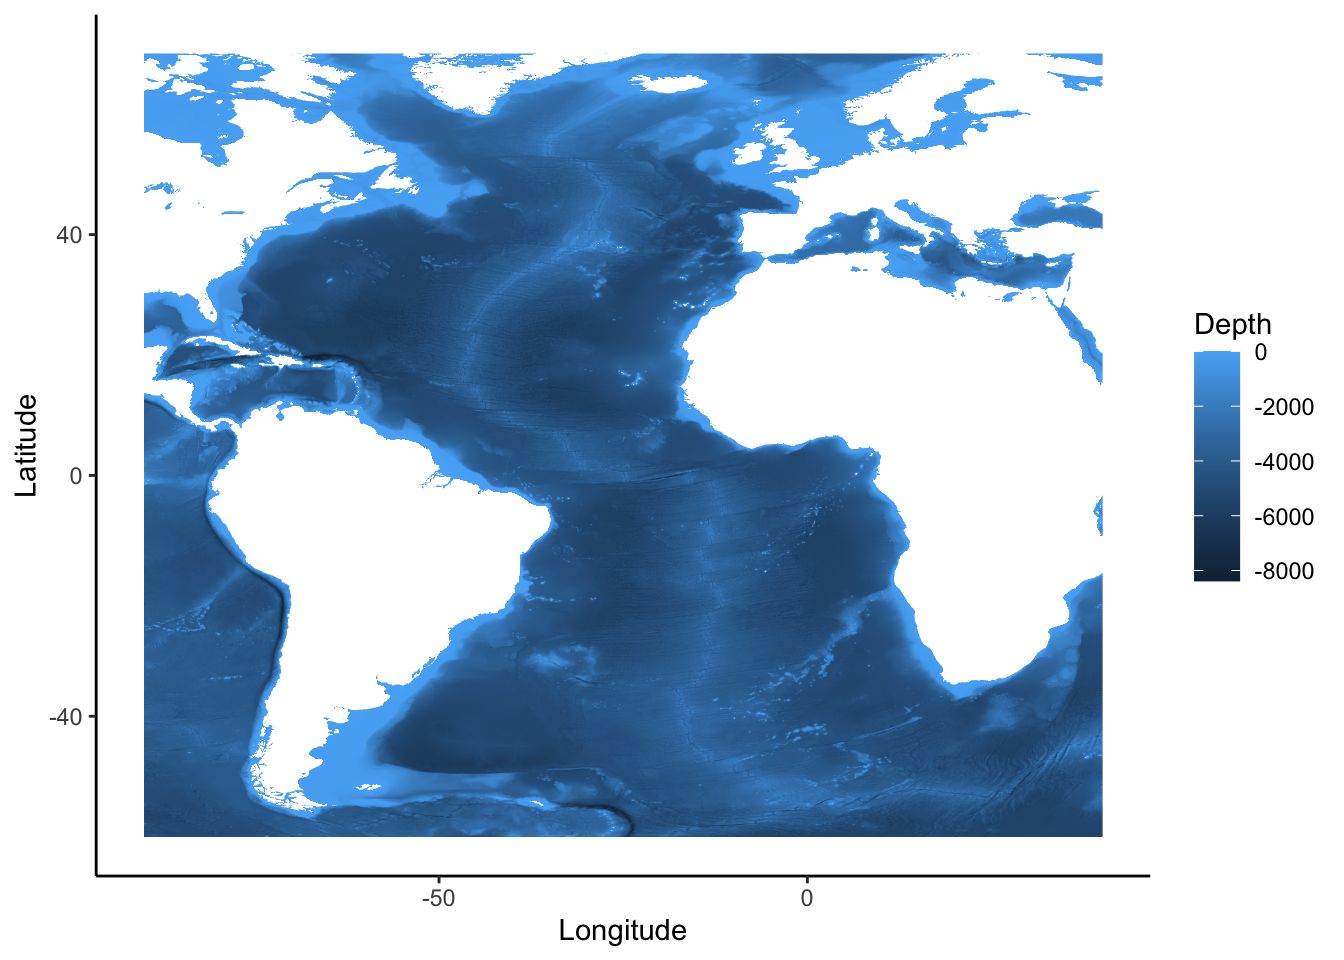
Okay so now we have some regular gridded bathymetry data but it isn’t the same projection we have our base map in, so if we try plot together it will be rather wrong. Infact on the global scale our bathymetry data which range from -90 to 40 in longitude and 70 to -60 in latitude are not even visible on a map using this projection.
Projection3D<-"+proj=laea +lat_0=0 +lon_0=-30 +x_0=43210000 +y_0=3210000 +ellps=GRS80 +towgs84=0,0,0,0,0,0,0 +units=m +no_defs"

world_map %>%
  st_transform(Projection3D) %>%
ggplot()+
  geom_sf()+
  geom_tile(data=bat_xyz,aes(x=Longitude,y=Latitude,fill=Depth))+
  theme_classic()
So what we will do is convert the dataframe to a spatial object. We could use sf to do this. Then we can easily transform it to the projection we want! To do this we can use the st_as_sf() function. One issue is we will need to tell sf what projection our latitude and longitude data are. Thankfully getNOAAA.bathy() uses EPSG:4326.
Bathy_sf<-st_as_sf(bat_xyz,coords = c("Longitude","Latitude"),crs=4326) %>%
  st_transform(Projection3D)


world_map %>%
  st_transform(Projection3D) %>%
ggplot()+
  geom_sf()+
  geom_sf(data=Bathy_sf,aes(fill=Depth))+
  theme_classic()
This doesn’t look like it has worked, what is happening is that each row of the sf is thought of as a point, ggplot is then plotting those points. It would be better for speed of plotting and how the plot looks if we use a raster format, as this is how the data are laid out. We can use the terra package to do this.
#install.packages("terra")
#install.packages("tidyterra")

library(terra)
library(tidyterra)

Bathy_terra<-as_spatraster(bat_xyz,xycols = c(1:2),crs=4326) %>%
  project(Projection3D)


world_map %>%
  st_transform(Projection3D) %>%
ggplot()+
  geom_sf()+
  geom_spatraster(data=Bathy_terra,aes(fill=Depth))+
  theme_classic()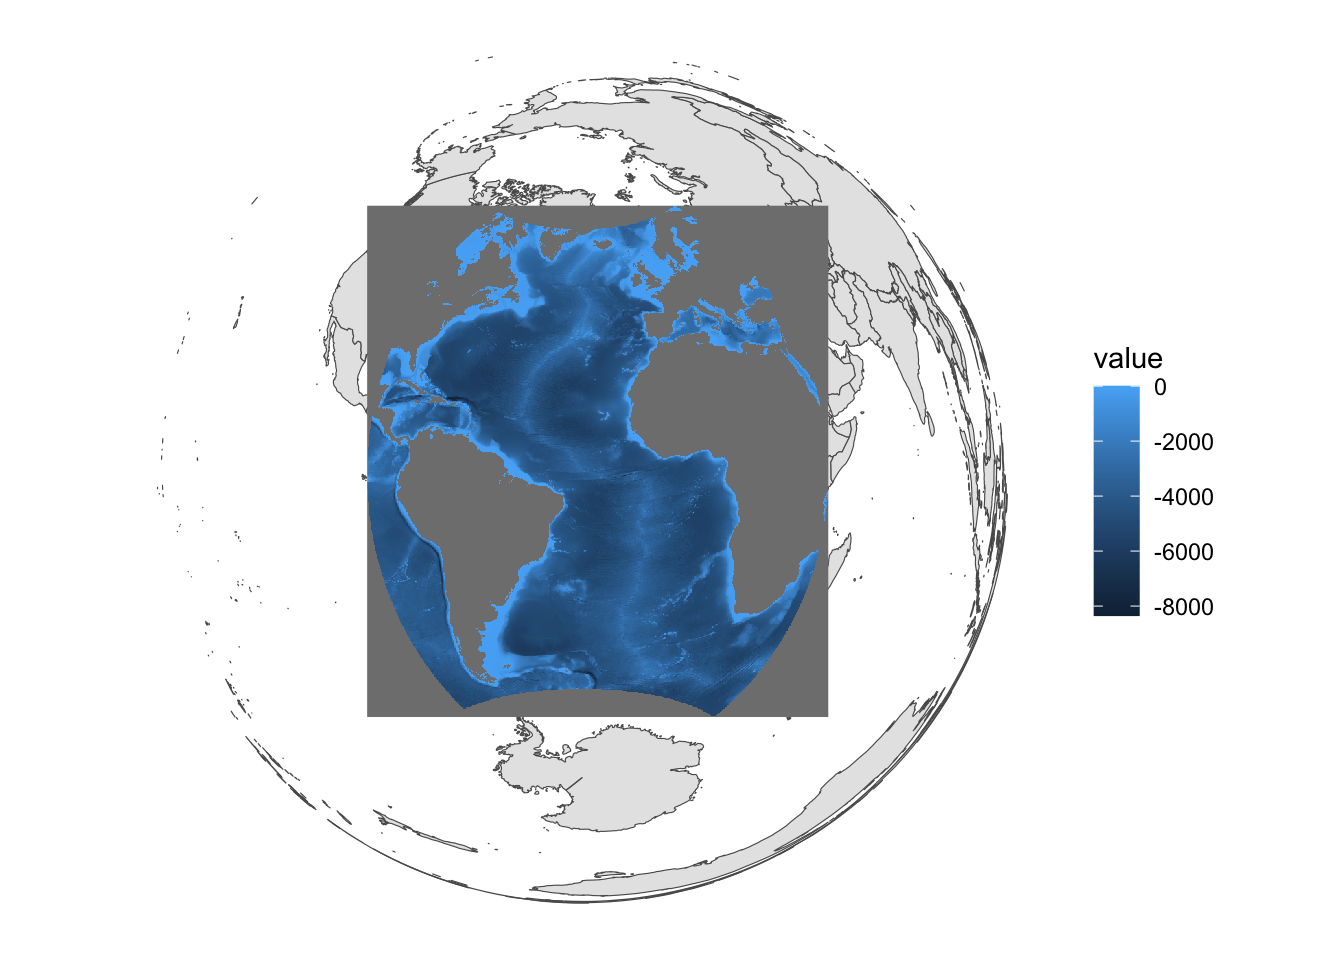
Okay, this is good, the projection is correct and the detail is enough for our current zoom level. The main issue now seems to be the NA values in the spat raster being plotted in a grey colour. So lets plot this with a nicer colour palette, and maybe we want our map lines to be on top of the bathymetry?
world_map %>%
  st_transform(Projection3D) %>%
ggplot()+
  geom_spatraster(data=Bathy_terra,aes(fill=Depth))+
  geom_sf()+
  scale_fill_viridis_c(na.value = NA)+
  theme_classic()
Hmmm maybe it would be nicer with a full global bathymetry? Or we could zoom into the area we have bathymetry for? Or both?
bat_whole <- getNOAA.bathy(lon1=-180,lon2=180,lat1=90,lat2=-90, res = 10)

Bathy_Whole_World <- as.xyz(bat_whole) %>%
  rename(Longitude=V1,Latitude=V2,Depth=V3) %>%
  filter(Depth<1) %>%
  as_spatraster(xycols = c(1:2),crs=4326) %>%
  project(Projection3D)

world_map %>%
  st_transform(Projection3D) %>%
ggplot()+
  geom_spatraster(data=Bathy_Whole_World,aes(fill=Depth))+
  geom_sf()+
  scale_fill_viridis_c(na.value = NA)+
  theme_classic()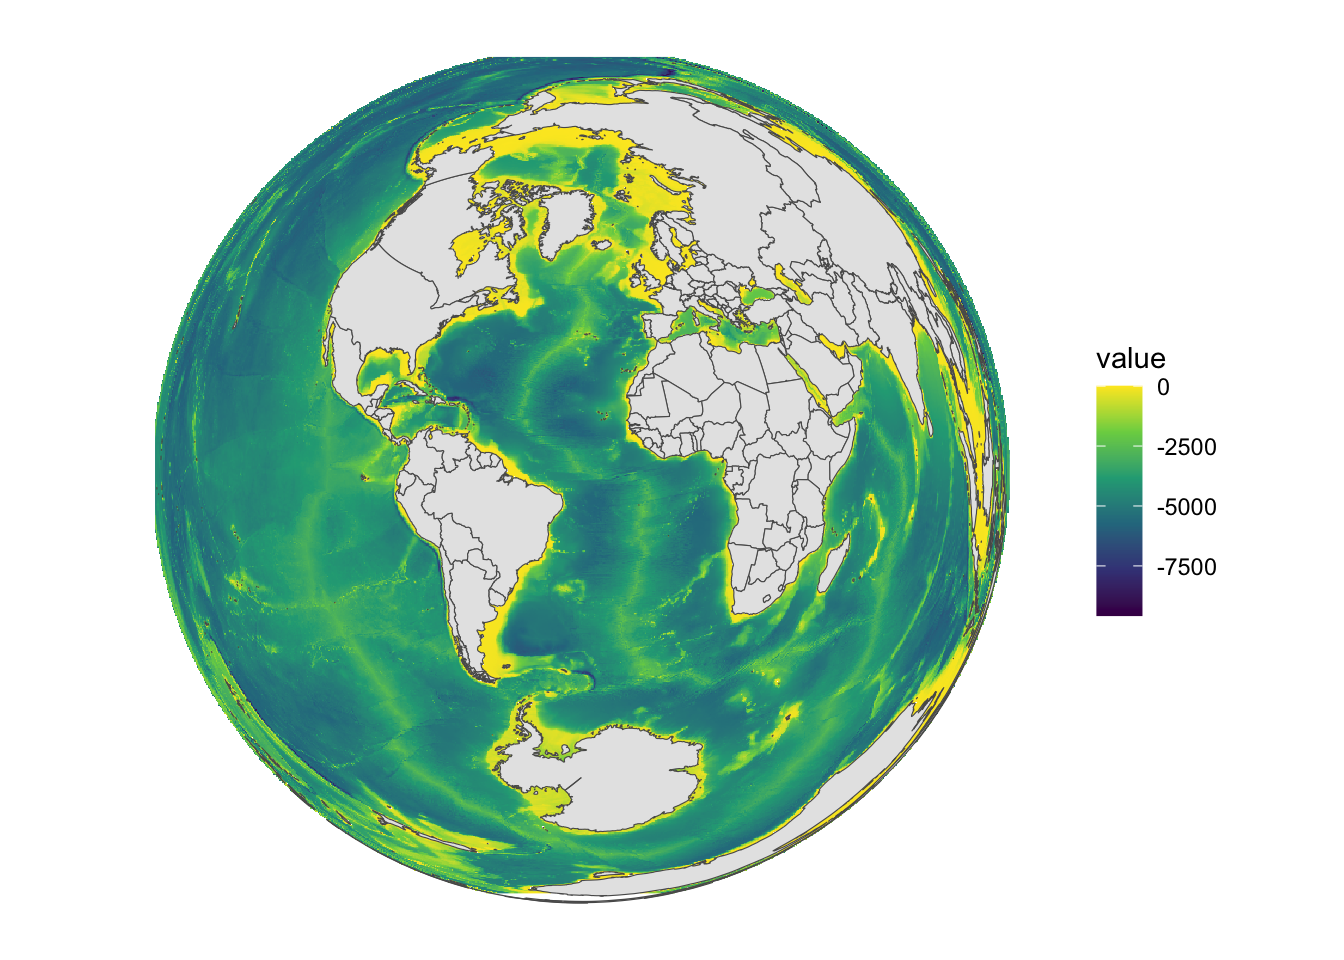
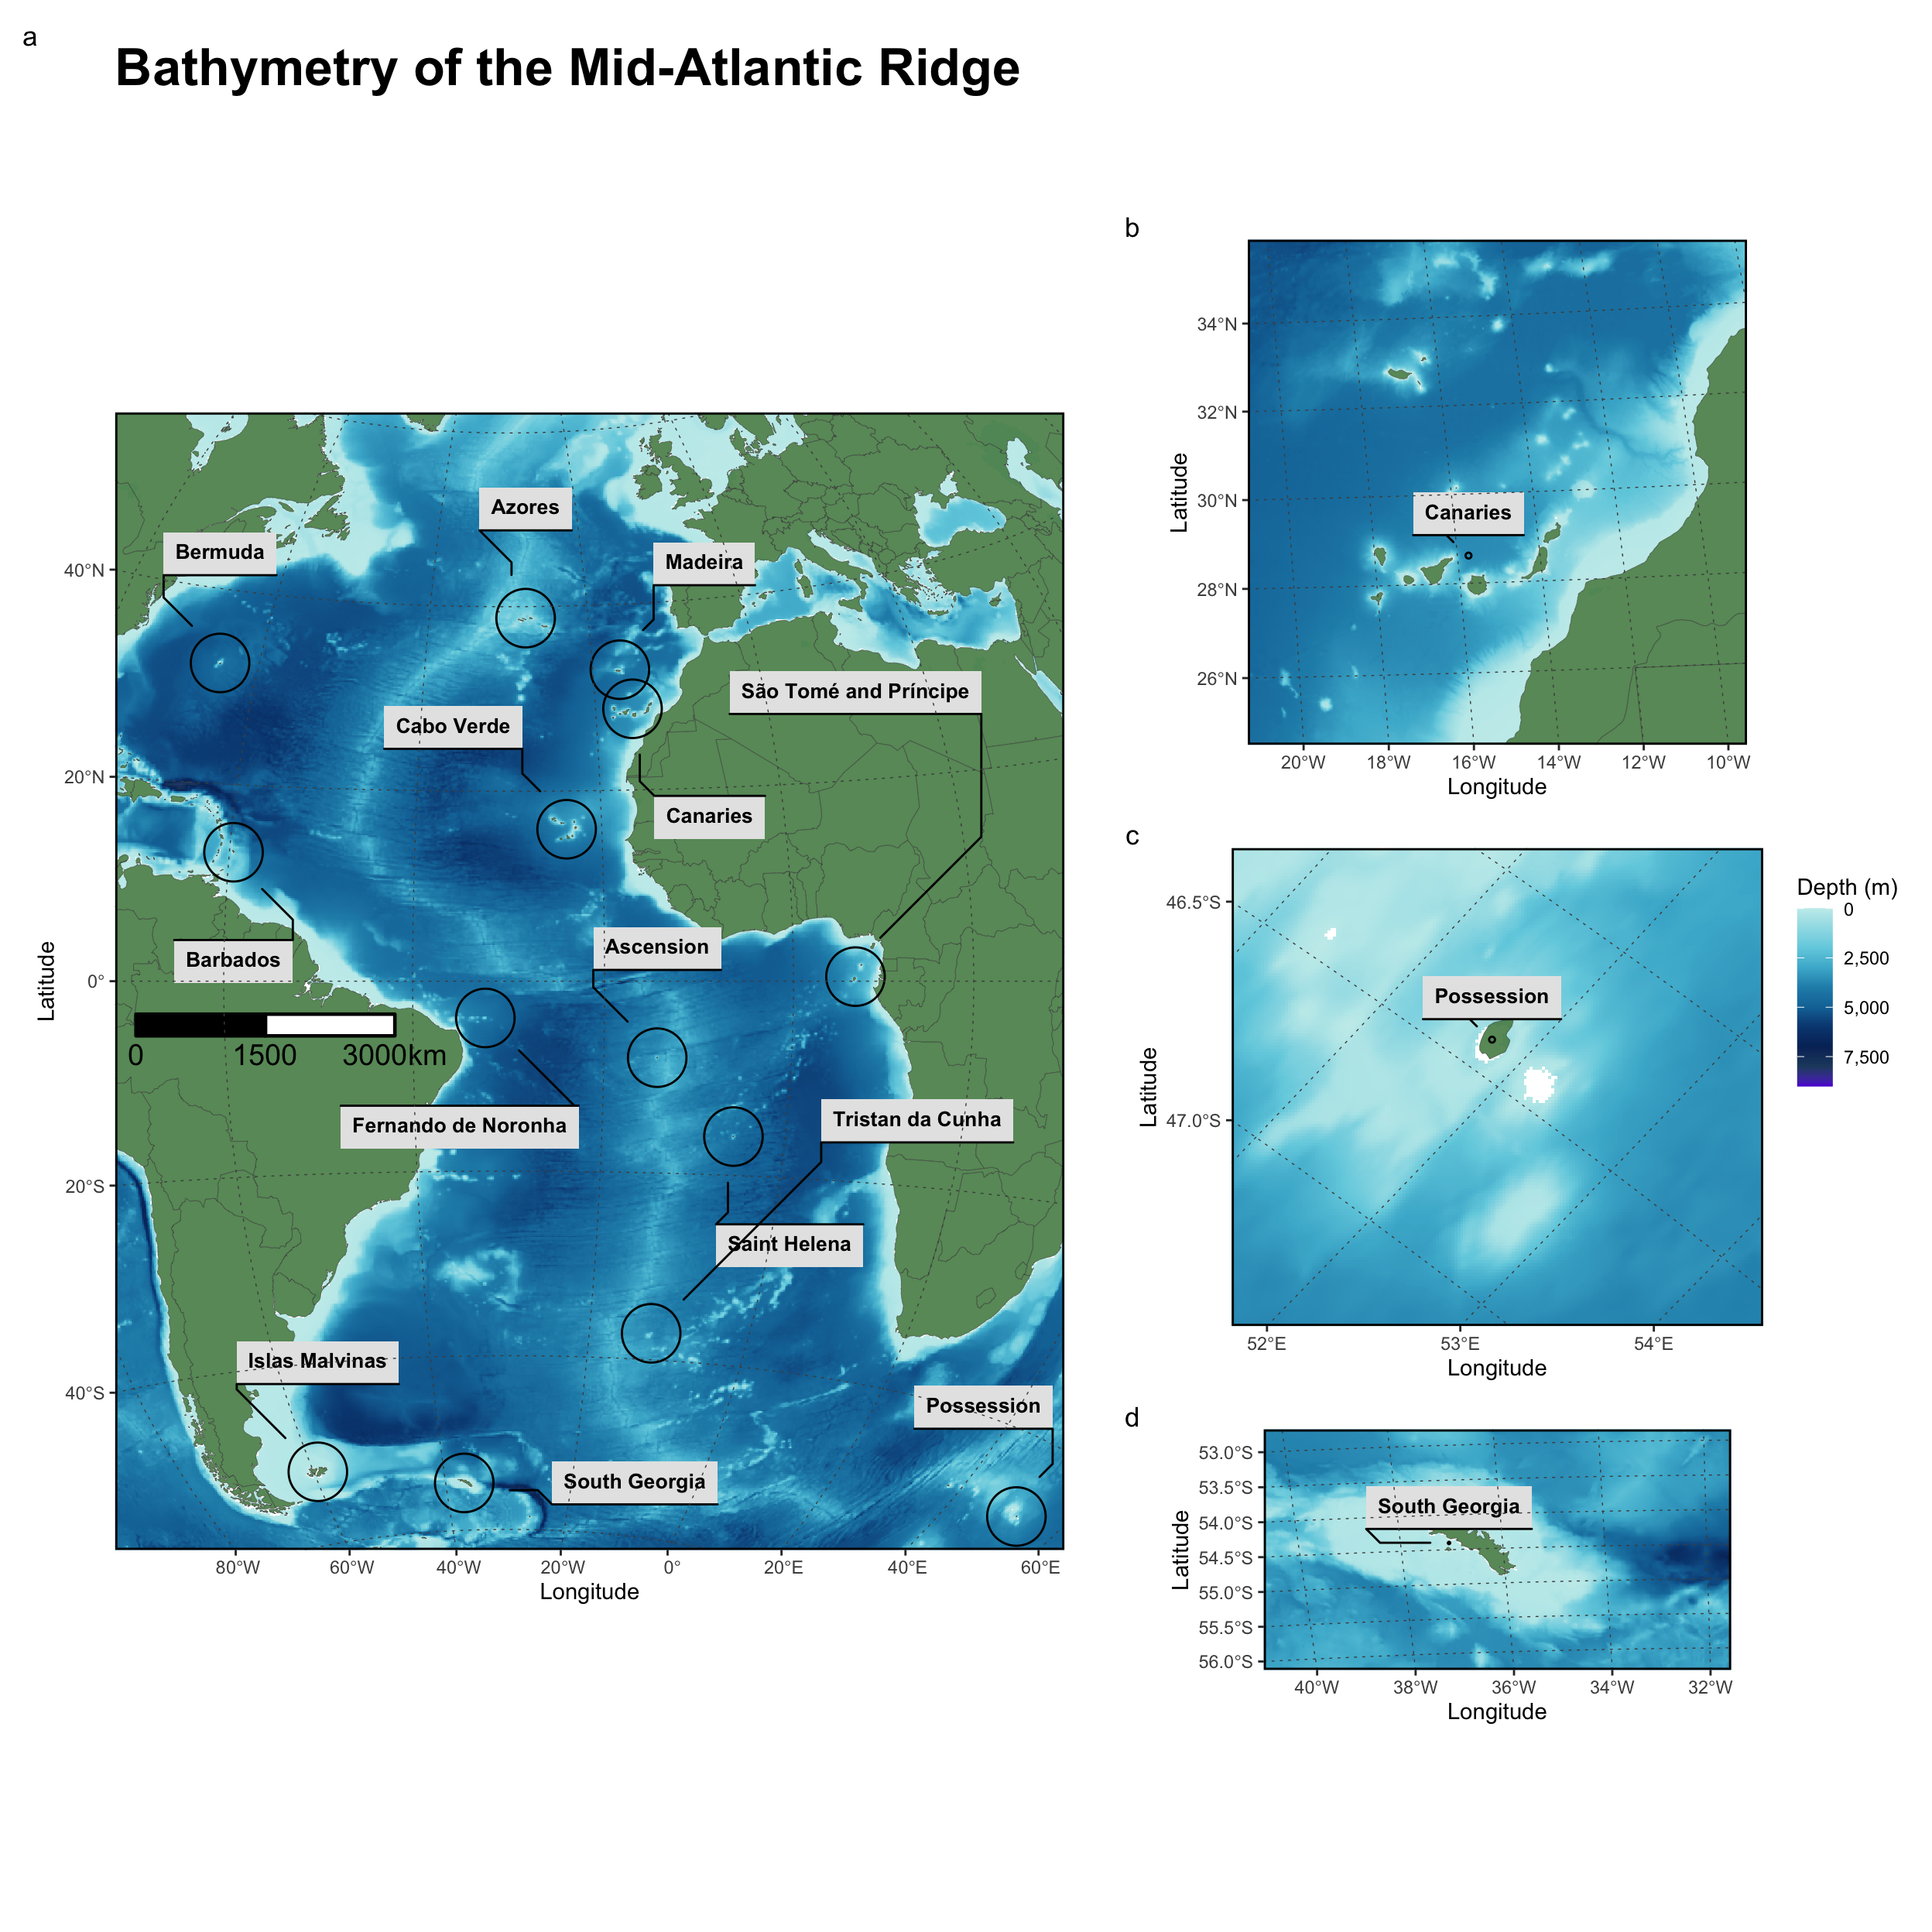
Lets also make some labels of points of interest, and lets zoom in on the mid atlantic ridge because it is very cool! Always have to refer to Marie Tharp for her magnificent, literally world changing work on mapping and effectively discovering this region of the ocean!
As our projection works in metres it would be a lot of trial and error to get the correct values, but we can create an sf object with the latitude and longitude we want then transform it and use that to create our limits! I will just look up some islands and archipelagoes and their Latitudes and Longitudes and add them as labels with the ggforce package function geom_mark_ellipse().
#install.packages("sfheaders")

library(sfheaders)
library(ggforce)Crop_MAR<-data.frame(
lon = c(-80,50,-80,50),
lat = c(-45,-45,45,45)
) %>%
st_as_sf(coords=c("lon","lat"), crs = 4326) %>%
st_transform(Projection3D) %>%
sf_to_df(fill=T)
InterestingPoints<-data.frame(
lon = c(-27.862,-14.3737,-15.7315,-16.751,-64.7896,
-23.777,-32.425,6.739,-5.705,-12.2821,-37.05,
-59.364,51.741,-59.5463),
lat = c(38.723,-7.9481,28.620,32.860,32.352,15.9495,
-3.8543,0.4535,-15.9697,-37.115,-54.403,-51.772,
-46.4046,13.102),
Islands= c("Azores","Ascension","Canaries","Madeira",
"Bermuda","Cabo Verde","Fernando de Noronha",
"São Tomé and Príncipe","Saint Helena","Tristan da Cunha",
"South Georgia","Islas Malvinas","Possession","Barbados")
) %>%
st_as_sf(coords=c("lon","lat"), crs = 4326) %>%
st_transform(Projection3D) %>%
sf_to_df(fill=T)world_map %>%
st_transform(Projection3D) %>%
ggplot()+
geom_spatraster(data=Bathy_Whole_World,aes(fill=Depth))+
geom_sf()+
geom_mark_ellipse(data=InterestingPoints,
aes(x=x,
y=y,
label = Islands,
group=Islands))+
scale_fill_viridis_c(na.value = NA)+
coord_sf(xlim=c(min(Crop_MAR$x),max(Crop_MAR$x)),
ylim=c(min(Crop_MAR$y),max(Crop_MAR$y)))+
theme_classic()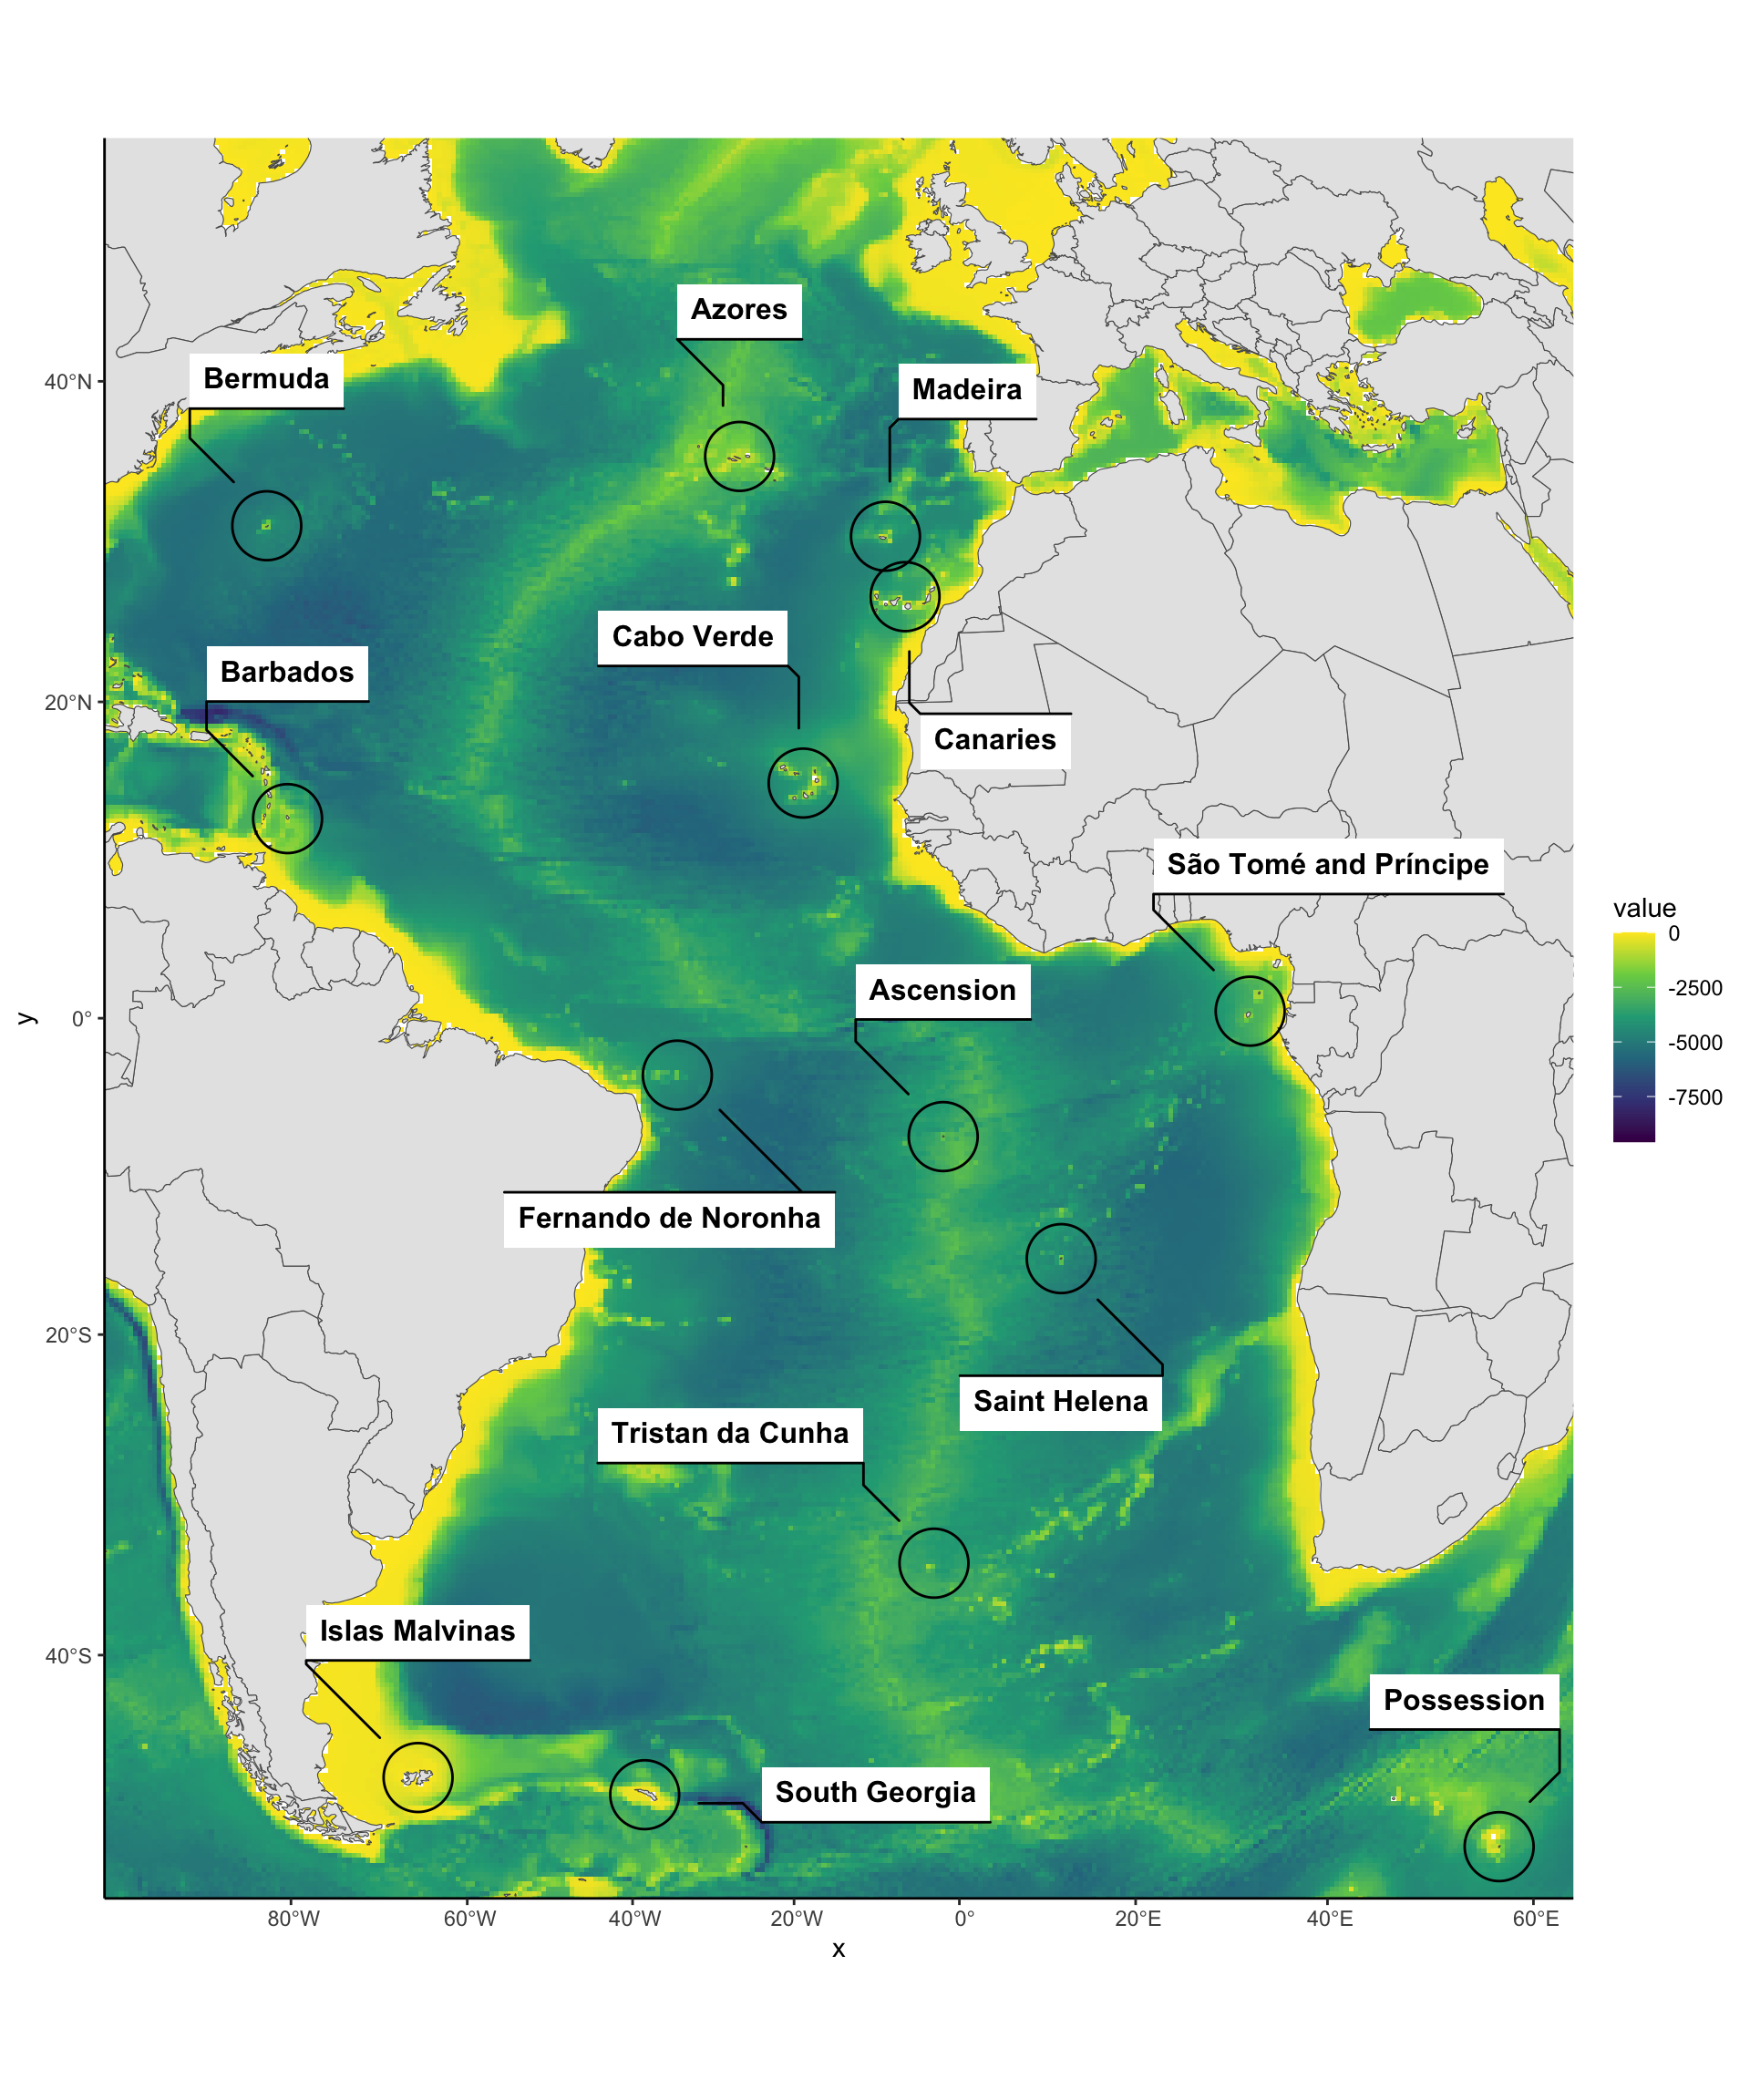
Step 3 - Appearance
Appearance is very down to personal preference but is all just using ggplot theme and scale elements. For a map this big i think a scale bar is unneccesary (but we will put a small one in anyway) and in my opinion a North arrow is never useful (except for navigational maps), as having Latitude on the y axis and Longitude on the x axis removes its utility.
Here I add nicer legend labels. Again it is personal preference but Depth in my opinion should be positive going deeper. I also add a scale bar, although with this projection it will change how big it should be for different areas of the map. I change the colour scheme of the bathymetry to be a blue palette. Then I add Labels for x and y, and a caption of data source. I add some grid lines to show latitude and longitude lines with theme().
#install.packages("ggsn")

library(ggsn)

world_map %>%
  st_transform(Projection3D) %>%
ggplot()+
  geom_spatraster(data=Bathy_Whole_World,aes(fill=Depth), maxcell = 5005560)+
  geom_sf(linewidth=0.1,alpha=0.9,
          fill="palegreen4",colour="grey30")+
geom_mark_ellipse(data=InterestingPoints,
               aes(x=x,
                   y=y,
                   label = Islands,
                   group=Islands) ,
               show.legend=F,
               alpha=0.8,
               label.buffer = unit(1, "mm"),
               label.fill = "grey80")+
  scale_fill_gradientn(colours=c("#5e24d6","#22496d","#042f66","#054780","#1074a6",
                                "#218eb7","#48b5d2","#72d0e1","#9ddee7","#c6edec"),
                       breaks=c(0,-2500,-5000,-7500),
                       labels=c("0","2,500","5,000","7,500"),
                       na.value = NA)+
  coord_sf(xlim=c(min(Crop_MAR$x),max(Crop_MAR$x)),
           ylim=c(min(Crop_MAR$y),max(Crop_MAR$y)))+
  scalebar(world_map %>%  st_transform(Projection3D),
           dist = 1500, dist_unit = "km",
                 transform=FALSE,
                 st.dist=0.008,
                 height=0.01,
                 location="bottomright",
                 anchor=c(x=min(Crop_MAR$x)*1.07,
                          y=max(Crop_MAR$y)*0.25),
                 border.size = 0.8)+
  labs(x="Longitude",y="Latitude",
       caption = "Data Source: National Oceanic and Atmospheric Administration (NOAA)",
       title = "Bathymetry of the Mid-Atlantic Ridge",fill="Depth (m)")+
  theme(panel.background = element_blank(), # bg of the panel
    panel.grid.major = element_line(linetype = "dotted",
                                             colour="grey30",
                                             linewidth=0.25),
    panel.ontop = TRUE,
    panel.grid.minor = element_blank(),
    panel.border = element_rect(colour = "black", fill=NA, linewidth=1))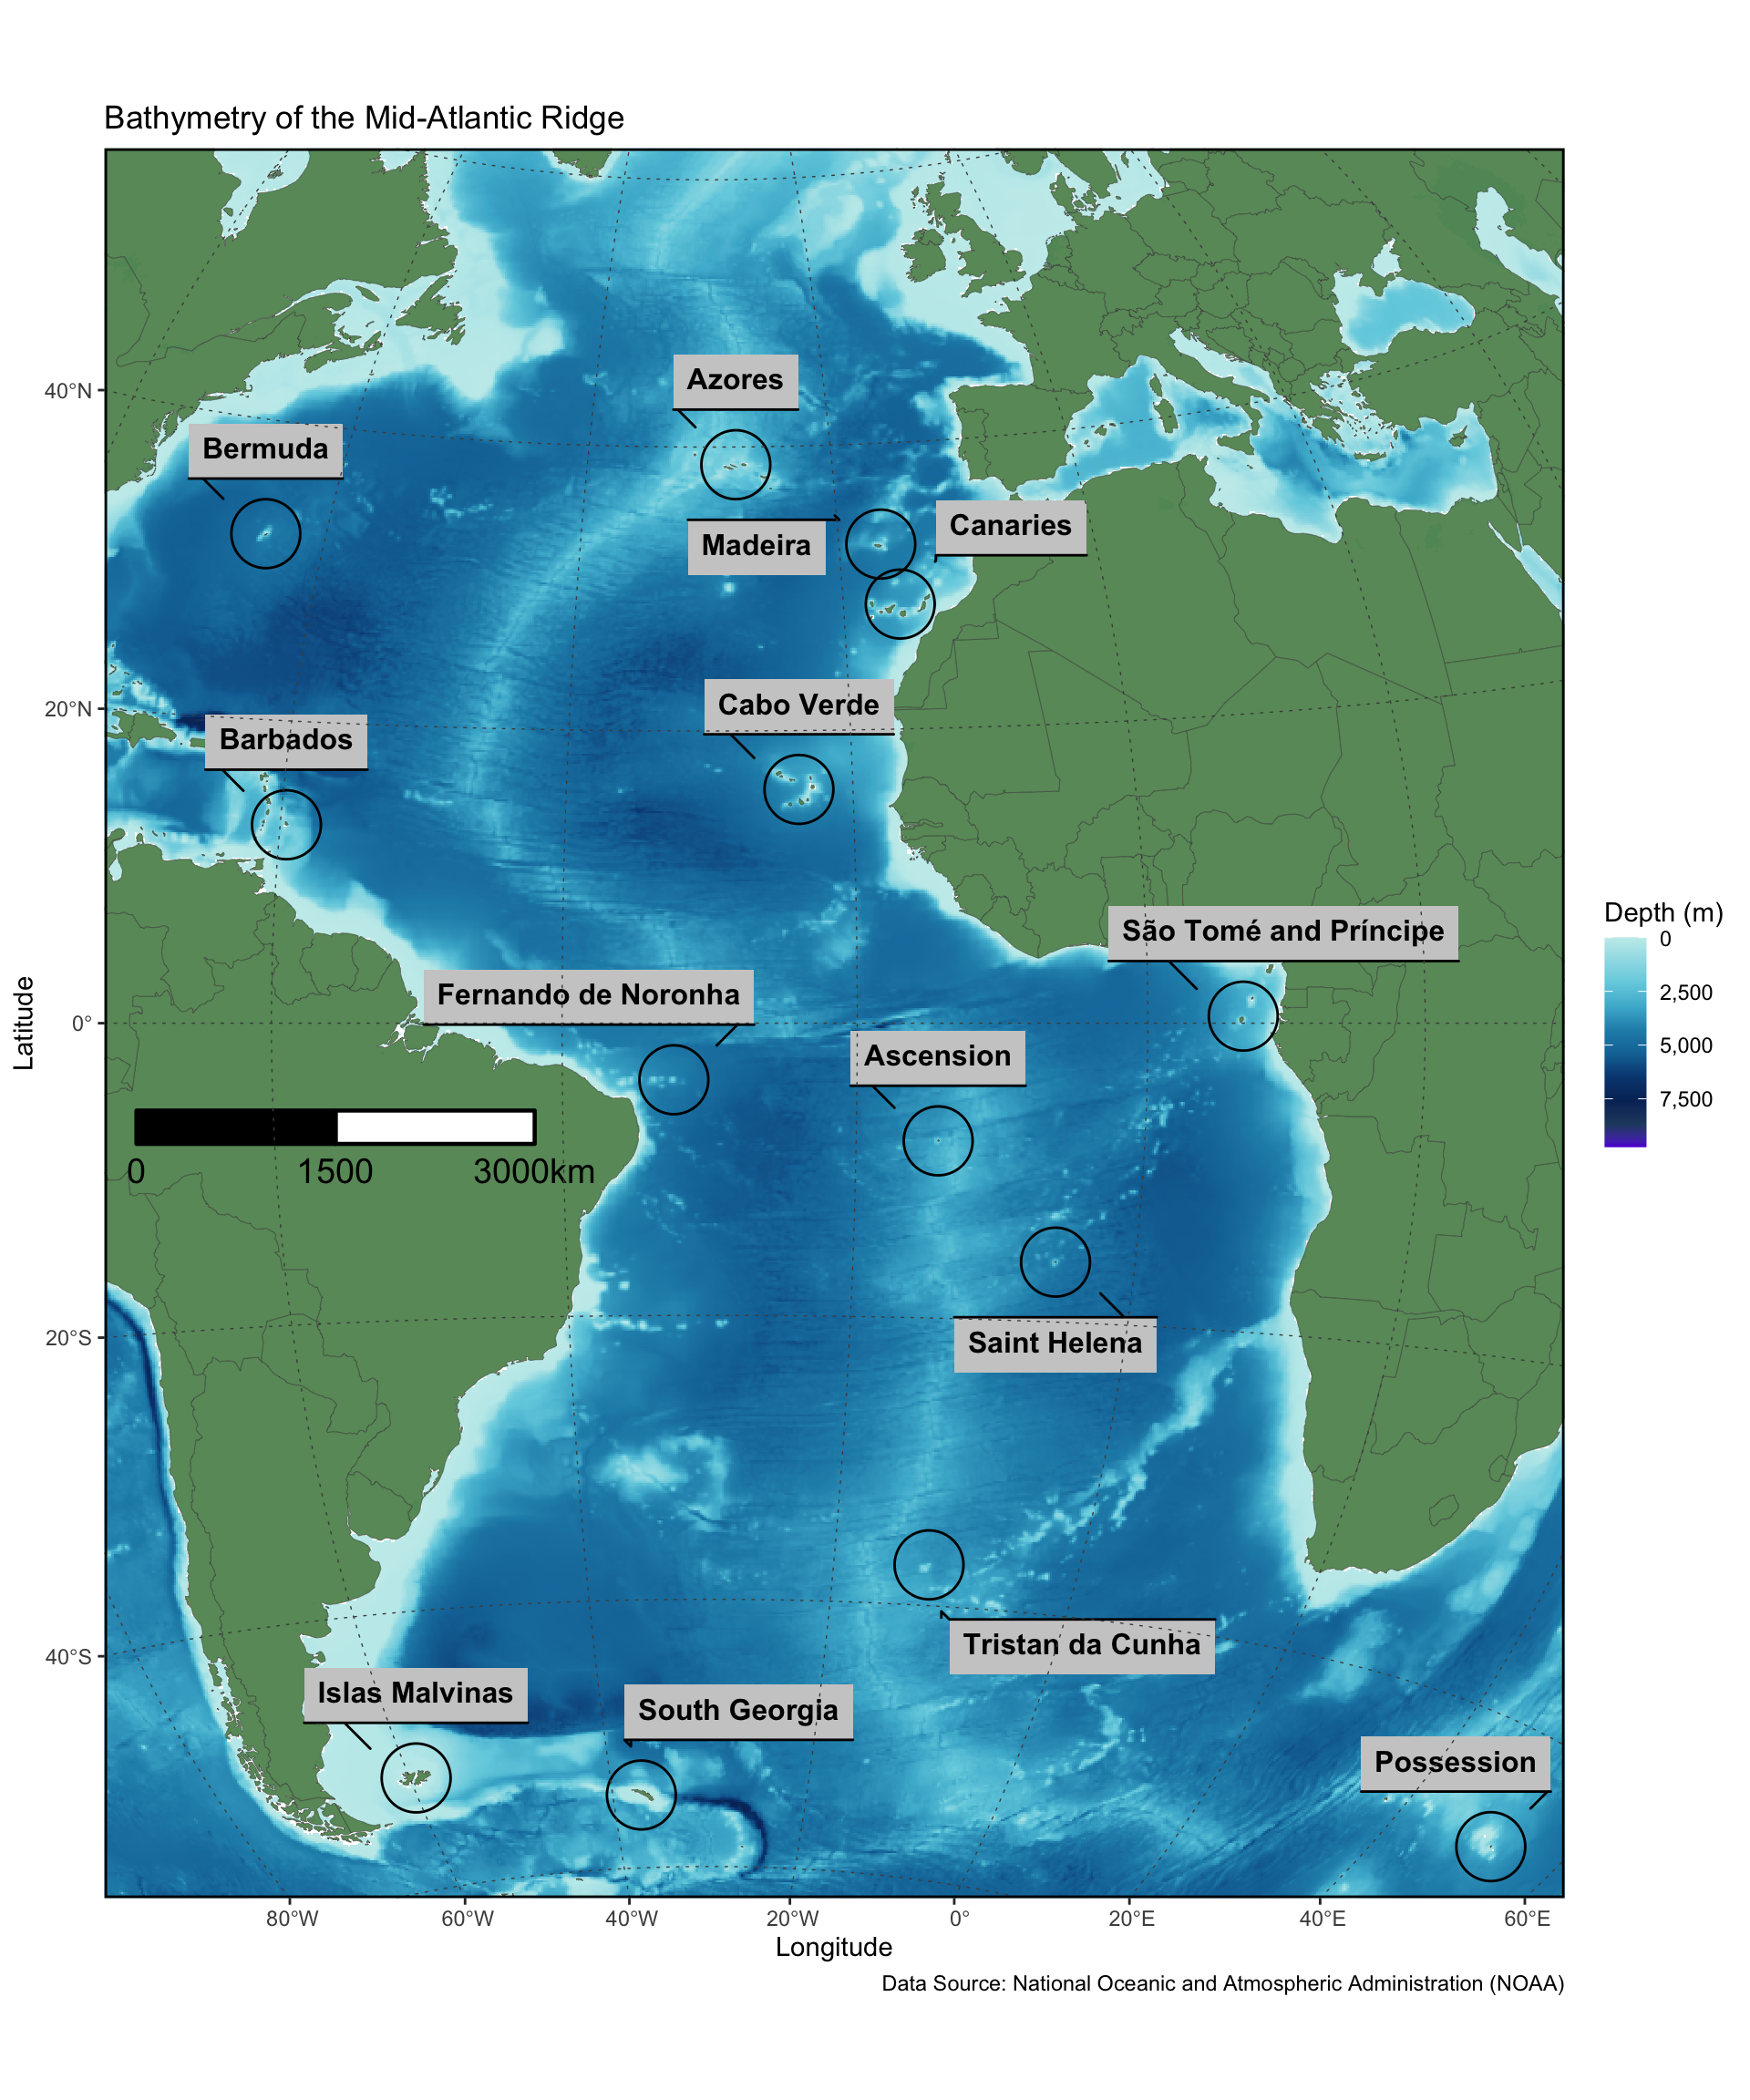
Extra Complex Zoom-in
For this we will be our big map and then zooming in to two regions of the map and plotting them with patchwork to try make a nice plot. First we save our base map. Then create a zoom in of the Canaries, Possession and South Georgia. We will download higher resolution imagery and world maps for these so the aren’t pixelated looking. Note we set the limits of the fill scale to be the same for each so the same palette is used for each.
world_map_HighRes<- ne_countries(returnclass = "sf",scale = 10)

bat_whole_Canaries <- getNOAA.bathy(lon1=-30,lon2=0,lat1=15,lat2=45, res = 1)

Bathy_Canaries <- as.xyz(bat_whole_Canaries) %>%
  rename(Longitude=V1,Latitude=V2,Depth=V3) %>%
  filter(Depth<1) %>%
  as_spatraster(xycols = c(1:2),crs=4326) %>%
  project(Projection3D)

bat_whole_SouthGeorgia <- getNOAA.bathy(lon1=-45,lon2=-25,lat1=-58,lat2=-50, res = 1)

Bathy_SouthGeorgia <- as.xyz(bat_whole_SouthGeorgia) %>%
  rename(Longitude=V1,Latitude=V2,Depth=V3) %>%
  filter(Depth<1) %>%
  as_spatraster(xycols = c(1:2),crs=4326) %>%
  project(Projection3D)

bat_whole_Possession <- getNOAA.bathy(lon1=45,lon2=65,lat1=-50,lat2=-42, res = 1)

Bathy_Possession <- as.xyz(bat_whole_Possession) %>%
  rename(Longitude=V1,Latitude=V2,Depth=V3) %>%
  filter(Depth<1) %>%
  as_spatraster(xycols = c(1:2),crs=4326) %>%
  project(Projection3D)
Now just the same plotting code for each plot to be saved as global objects.
Code
BaseMap<-world_map %>%
  st_transform(Projection3D) %>%
ggplot()+
  geom_spatraster(data=Bathy_Whole_World,aes(fill=Depth), maxcell = 5005560)+
  geom_sf(linewidth=0.1,alpha=0.9,
          fill="palegreen4",colour="grey30")+
geom_mark_ellipse(data=InterestingPoints,
               aes(x=x,
                   y=y,
                   label = Islands,
                   group=Islands) ,
               show.legend=F,
               alpha=0.8,
  label.fontsize = 10,
label.buffer = unit(8, "mm"),
label.fill = "grey90")+
  scale_fill_gradientn(colours=c("#5e24d6","#22496d","#042f66","#054780","#1074a6",
                                "#218eb7","#48b5d2","#72d0e1","#9ddee7","#c6edec"),
                       breaks=c(0,-2500,-5000,-7500),
                       labels=c("0","2,500","5,000","7,500"),
                       limits=c(-9000,0),
                       na.value = NA)+
  coord_sf(xlim=c(min(Crop_MAR$x),max(Crop_MAR$x)),
           ylim=c(min(Crop_MAR$y),max(Crop_MAR$y)))+
  scalebar(world_map %>%  st_transform(Projection3D),
           dist = 1500, dist_unit = "km",
                 transform=FALSE,
                 st.dist=0.0085,
                 height=0.01,
                 location="bottomright",
                 anchor=c(x=min(Crop_MAR$x)*1.07,
                          y=max(Crop_MAR$y)*0.28),
                 border.size = 0.8)+
  labs(x="Longitude",y="Latitude",
       title = "Bathymetry of the Mid-Atlantic Ridge",fill="Depth (m)")+
  theme(panel.background = element_blank(), # bg of the panel
    panel.grid.major = element_line(linetype = "dotted",
                                             colour="grey30",
                                             linewidth=0.25),
    panel.ontop = TRUE,
    panel.grid.minor = element_blank(),
    panel.border = element_rect(colour = "black", fill=NA, linewidth=1))

Canaries<-data.frame(
  lon = c(-20,-10,-20,-10),
  lat = c(25,25,35,35)
) %>%
  st_as_sf(coords=c("lon","lat"), crs = 4326) %>%
  st_transform(Projection3D) %>%
  sf_to_df(fill=T)


CanariesMap<-world_map_HighRes %>%
  st_transform(Projection3D) %>%
ggplot()+
  geom_spatraster(data=Bathy_Canaries,aes(fill=Depth), maxcell = 5005560)+
  geom_sf(linewidth=0.1,alpha=0.9,
          fill="palegreen4",colour="grey30")+
geom_mark_ellipse(data=InterestingPoints %>%
                    filter(Islands=="Canaries"),
               aes(x=x,
                   y=y,
                   label = Islands,
                   group=Islands) ,
               show.legend=F,
               alpha=0.8,
  label.fontsize = 10,
expand = unit(0.5, "mm") ,
radius = unit(0.5, "mm") ,
label.buffer = unit(1, "mm"),
label.fill = "grey90")+
  scale_fill_gradientn(colours=c("#5e24d6","#22496d","#042f66","#054780","#1074a6",
                                "#218eb7","#48b5d2","#72d0e1","#9ddee7","#c6edec"),
                       limits=c(-9000,0),
                       breaks=c(0,-2500,-5000,-7500),
                       labels=c("0","2,500","5,000","7,500"),
                       na.value = NA)+
  coord_sf(xlim=c(min(Canaries$x),max(Canaries$x)),
           ylim=c(min(Canaries$y),max(Canaries$y)))+
  labs(x="Longitude",y="Latitude",fill="Depth (m)")+
  theme(panel.background = element_blank(), # bg of the panel
    panel.grid.major = element_line(linetype = "dotted",
                                             colour="grey30",
                                             linewidth=0.25),
    panel.ontop = TRUE,
    panel.grid.minor = element_blank(),
    panel.border = element_rect(colour = "black", fill=NA, linewidth=1))

SouthGeorgia<-data.frame(
  lon = c(-40,-32,-40,-32),
  lat = c(-56,-56,-53,-53)
) %>%
  st_as_sf(coords=c("lon","lat"), crs = 4326) %>%
  st_transform(Projection3D) %>%
  sf_to_df(fill=T)


SGeorgiaMap<-world_map_HighRes %>%
  st_transform(Projection3D) %>%
ggplot()+
  geom_spatraster(data=Bathy_SouthGeorgia,aes(fill=Depth), maxcell = 5005560)+
  geom_sf(linewidth=0.1,alpha=0.9,
          fill="palegreen4",colour="grey30")+
geom_mark_ellipse(data=InterestingPoints %>%
                    filter(Islands=="South Georgia"),
               aes(x=x,
                   y=y,
                   label = Islands,
                   group=Islands) ,
               show.legend=F,
               alpha=0.8,
  label.fontsize = 10,
expand = unit(0.2, "mm") ,
radius = unit(0.2, "mm") ,
label.buffer = unit(0.2, "mm"),
label.fill = "grey90")+
  scale_fill_gradientn(colours=c("#5e24d6","#22496d","#042f66","#054780","#1074a6",
                                "#218eb7","#48b5d2","#72d0e1","#9ddee7","#c6edec"),
                       limits=c(-9000,0),
                       breaks=c(0,-2500,-5000,-7500),
                       labels=c("0","2,500","5,000","7,500"),
                       na.value = NA)+
  coord_sf(xlim=c(min(SouthGeorgia$x),max(SouthGeorgia$x)),
           ylim=c(min(SouthGeorgia$y),max(SouthGeorgia$y)))+
  labs(x="Longitude",y="Latitude",fill="Depth (m)")+
  theme(panel.background = element_blank(), # bg of the panel
    panel.grid.major = element_line(linetype = "dotted",
                                             colour="grey30",
                                             linewidth=0.25),
    panel.ontop = TRUE,
    panel.grid.minor = element_blank(),
    panel.border = element_rect(colour = "black", fill=NA, linewidth=1))


Possession<-data.frame(
  lon = c(51,53,53,51),
  lat = c(-47,-47,-46,-46)
) %>%
  st_as_sf(coords=c("lon","lat"), crs = 4326) %>%
  st_transform(Projection3D) %>%
  sf_to_df(fill=T)

PossessionMap<-world_map_HighRes %>%
  st_transform(Projection3D) %>%
ggplot()+
  geom_spatraster(data=Bathy_Possession,aes(fill=Depth), maxcell = 5005560)+
  geom_sf(linewidth=0.1,alpha=0.9,
          fill="palegreen4",colour="grey30")+
geom_mark_ellipse(data=InterestingPoints%>%
                    filter(Islands=="Possession"),
               aes(x=x,
                   y=y,
                   label = Islands,
                   group=Islands) ,
               show.legend=F,
               alpha=0.8,
  label.fontsize = 10,
expand = unit(0.5, "mm") ,
radius = unit(0.5, "mm") ,
label.buffer = unit(1, "mm"),
label.fill = "grey90")+
  scale_fill_gradientn(colours=c("#5e24d6","#22496d","#042f66","#054780","#1074a6",
                                "#218eb7","#48b5d2","#72d0e1","#9ddee7","#c6edec"),
                       limits=c(-9000,0),
                       breaks=c(0,-2500,-5000,-7500),
                       labels=c("0","2,500","5,000","7,500"),
                       na.value = NA)+
  coord_sf(xlim=c(min(Possession$x),max(Possession$x)),
           ylim=c(min(Possession$y),max(Possession$y)))+
  labs(x="Longitude",y="Latitude",fill="Depth (m)")+
  theme(panel.background = element_blank(), # bg of the panel
    panel.grid.major = element_line(linetype = "dotted",
                                             colour="grey30",
                                             linewidth=0.25),
    panel.ontop = TRUE,
    panel.grid.minor = element_blank(),
    panel.border = element_rect(colour = "black", fill=NA, linewidth=1))
Now to plot together with Patchwork (See previous tutorial for more info)
library(patchwork)


layout<-c(
  patchwork::area(t=1,l=1,b=60,r=25),
  patchwork::area(t=5,l=27,b=25,r=40),
  patchwork::area(t=26,l=27,b=45,r=40),
  patchwork::area(t=46,l=27,b=55,r=40)
)

plot(layout)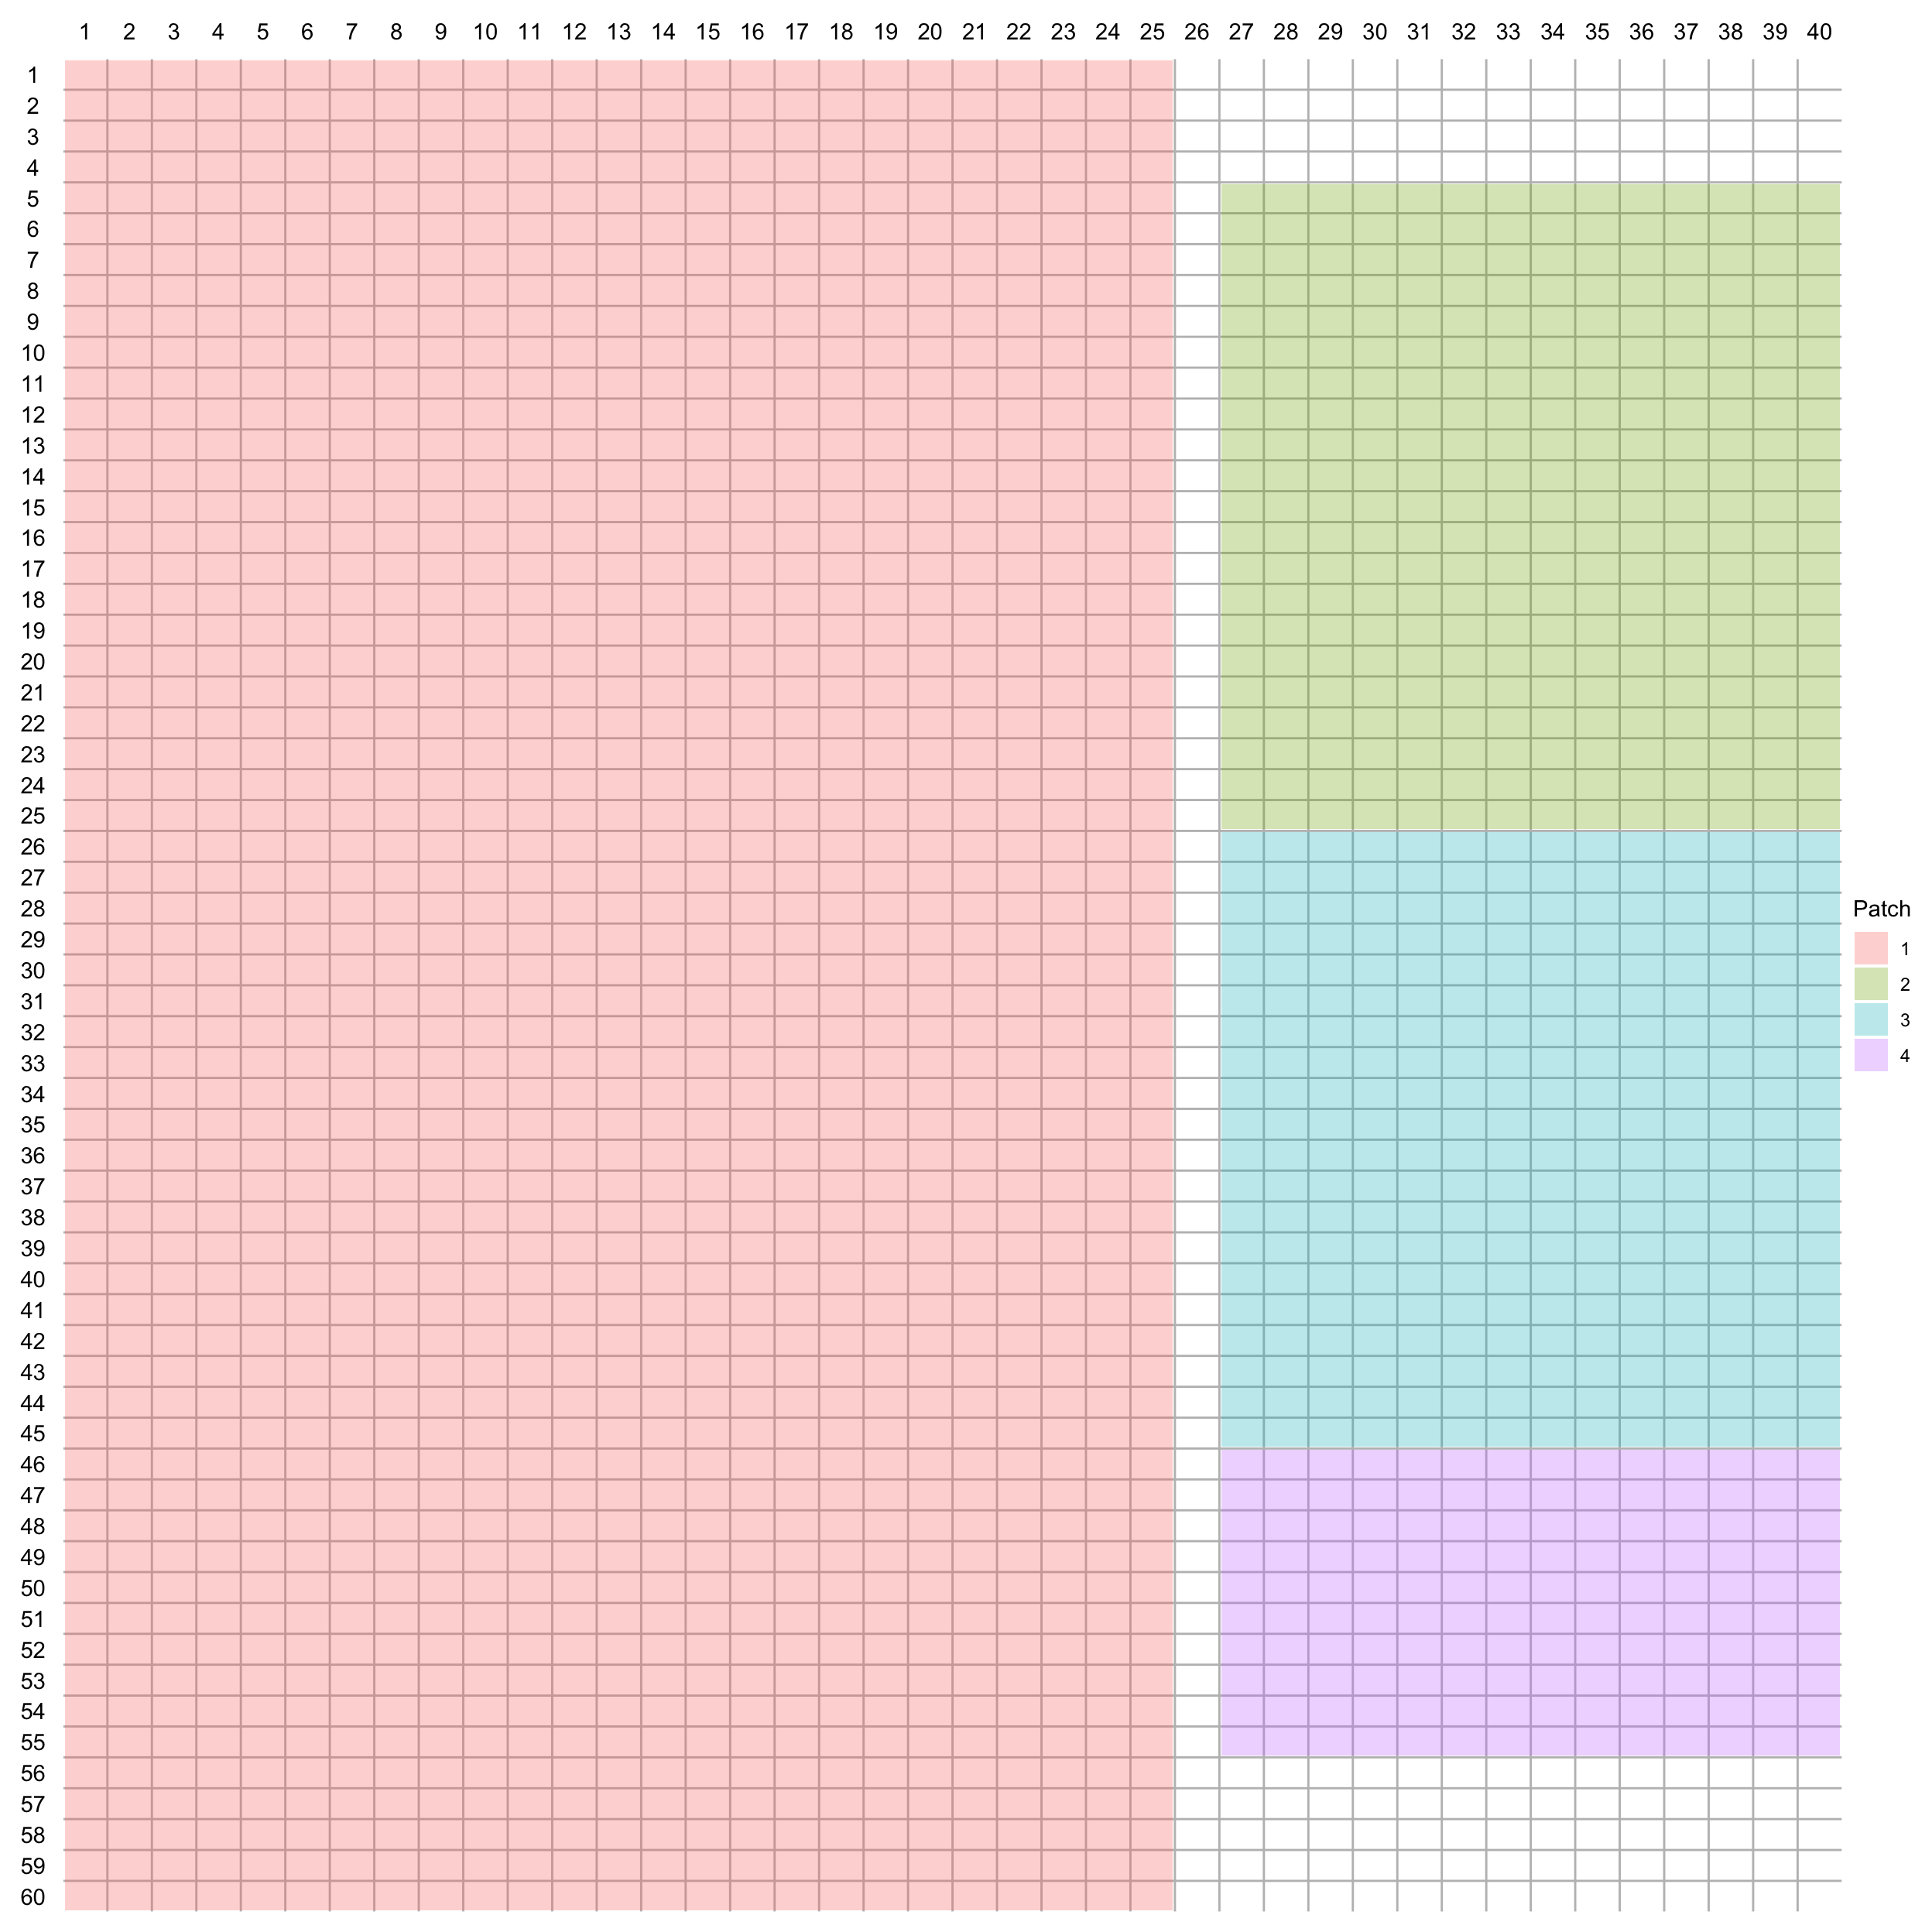
BaseMap+CanariesMap+PossessionMap+SGeorgiaMap+
  plot_layout(guides = "collect",design = layout)+
  plot_annotation(tag_levels = "a") &
  theme(plot.title = element_text(face = "bold",size=25))