Combining Multiple Plots in R

Introduction
Tidyverse
ggplot2
R
patchwork
A Introduction to Combining Plots in R for Research Scientists: From Facetting to Patchworks.
Published

October 8, 2023

Combining Visualisations

We have two options for plotting many plots together. The first would be using facetting, which is where you use the same response variables and split your plots across some grouping factor within your data. This can be very useful but is in specific gridded formats of data with each sub plot being the same size. Sometimes we won’t want that, if we are making a selection of plots and combining with images or maps or maybe just not related plots. To do this we can use a wide selection of packages such as cowplot, ggarrange, grid or Patchwork. My personal favourite is patchwork for its simplicity, integration with ggplot2 and its flexibility.

Facetting

For facetting we will normally be using at least one of the same axes across the plots. For example, we might look at the height to weight association across Starwars characters.

library(tidyverse)
── Attaching core tidyverse packages ──────────────────────── tidyverse 2.0.0 ──
✔ dplyr     1.1.4     ✔ readr     2.1.5
✔ forcats   1.0.0     ✔ stringr   1.5.1
✔ ggplot2   3.4.4     ✔ tibble    3.2.1
✔ lubridate 1.9.3     ✔ tidyr     1.3.1
✔ purrr     1.0.2     
── Conflicts ────────────────────────────────────────── tidyverse_conflicts() ──
✖ dplyr::filter() masks stats::filter()
✖ dplyr::lag()    masks stats::lag()
ℹ Use the conflicted package (<http://conflicted.r-lib.org/>) to force all conflicts to become errors
data("starwars")

glimpse(starwars)
Rows: 87
Columns: 14
$ name       <chr> "Luke Skywalker", "C-3PO", "R2-D2", "Darth Vader", "Leia Or…
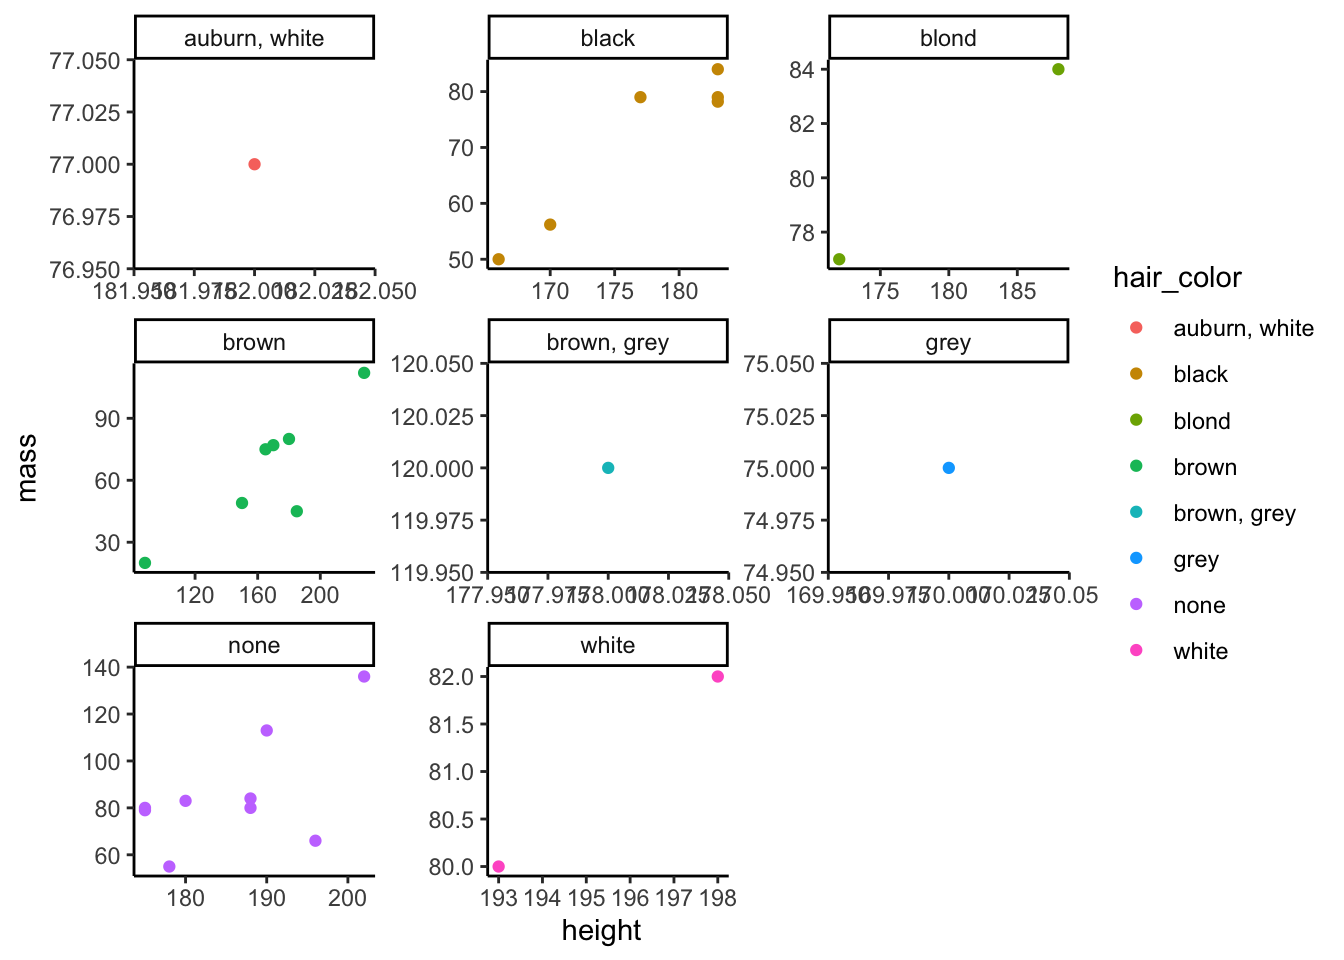
$ height     <int> 172, 167, 96, 202, 150, 178, 165, 97, 183, 182, 188, 180, 2…
$ mass       <dbl> 77.0, 75.0, 32.0, 136.0, 49.0, 120.0, 75.0, 32.0, 84.0, 77.…
$ hair_color <chr> "blond", NA, NA, "none", "brown", "brown, grey", "brown", N…
$ skin_color <chr> "fair", "gold", "white, blue", "white", "light", "light", "…
$ eye_color  <chr> "blue", "yellow", "red", "yellow", "brown", "blue", "blue",…
$ birth_year <dbl> 19.0, 112.0, 33.0, 41.9, 19.0, 52.0, 47.0, NA, 24.0, 57.0, …
$ sex        <chr> "male", "none", "none", "male", "female", "male", "female",…
$ gender     <chr> "masculine", "masculine", "masculine", "masculine", "femini…
$ homeworld  <chr> "Tatooine", "Tatooine", "Naboo", "Tatooine", "Alderaan", "T…
$ species    <chr> "Human", "Droid", "Droid", "Human", "Human", "Human", "Huma…
$ films      <list> <"A New Hope", "The Empire Strikes Back", "Return of the J…
$ vehicles   <list> <"Snowspeeder", "Imperial Speeder Bike">, <>, <>, <>, "Imp…
$ starships  <list> <"X-wing", "Imperial shuttle">, <>, <>, "TIE Advanced x1",…

Let’s assess height against mass of all the characters in this dplyr dataset.

starwars %>%
  drop_na() %>% 
  ggplot()+
  geom_point(aes(x=height,y=mass))+
  theme_classic()

Hmmm I wonder who that heavy thing is? Perhaps we want to look at the different species as different colours?

starwars %>% 
  drop_na() %>% 
  ggplot()+
  geom_point(aes(x=height,y=mass,colour=species))+
  theme_classic()

Hmm this is not that easy to see, and even facetting may not be that great but lets see.

starwars %>% 
  drop_na() %>% 
  ggplot()+
  geom_point(aes(x=height,y=mass,colour=species))+
  theme_classic()+
  facet_wrap(~species)

Maybe we could compare hair colour?

starwars %>% 
  drop_na() %>% 
  ggplot()+
  geom_point(aes(x=height,y=mass,colour=hair_color))+
  theme_classic()+
  facet_wrap(~hair_color)

Alot of characters without hair, okay lets allow each facet (individual subplot) to have a different y scale.

starwars %>% 
  drop_na() %>% 
  ggplot()+
  geom_point(aes(x=height,y=mass,colour=hair_color))+
  theme_classic()+
  facet_wrap(~hair_color,scales = "free_y")

That is better but we could also allow different scales for the x axis too?

starwars %>% 
  drop_na() %>% 
  ggplot()+
  geom_point(aes(x=height,y=mass,colour=hair_color))+
  theme_classic()+
  facet_wrap(~hair_color,scales = "free")

What does this look like for eye colour?

starwars %>% 
  drop_na() %>% 
  ggplot()+
  geom_point(aes(x=height,y=mass,colour=eye_color))+
  theme_classic()+
  facet_wrap(~eye_color,scales = "free")

Okay so none of these plots are very nice as the starwars characters are very well spread in their physical characteristics. Maybe we can group some of these lesser filled groups into “Other”? Then we can do a facet grid with Eye (rows) and Hair (columns) Colours grouped.

starwars %>% 
  mutate(eye_group=case_when(eye_color%in%c("black","brown","dark","red")~"Dark Eyes",
                             eye_color%in%c("blue","blue-gray","gold","green, yellow","hazel","orange","pink","red, blue",
                                            "white","yellow")~"Light Eyes",
                             TRUE~"Other"),
         hair_group=case_when(hair_color%in%c("brown","brown, grey","black")~"Dark Hair",
                             hair_color%in%c("blond","auburn, white", "auburn, grey",
                                             "white","grey","auburn","blonde","unknown")~"Light Hair",
                             TRUE~"Other")) %>% 
  drop_na()%>% 
  ggplot()+
  geom_point(aes(x=height,y=mass,colour=hair_group,shape=eye_group))+
  theme_classic()+
  facet_grid(eye_group~hair_group,scales = "free")

Not amazingly illuminating but shows the use of facets. When using facet grid it automatically removes repeated axes.

Lets maybe use a slightly different data set, next will be some mpg data from ggplot2. This data is to do with car mile per gallon and different elements of the engine.

We can use facet_wrap() or facet_grid(). we have to put a dot after the ‘~’ if we are only facetting by one column. We will look at the type of drive, which is front wheel drive (f), 4x4 (4) or rear-wheel drive (r).

data("mpg")

mpg2 <- mpg %>% 
  filter(cyl != 5 & class != "2seater")


 mpg2 %>% 
  ggplot(aes(x=cty, y=hwy, colour=drv)) + 
  geom_point()+
   facet_grid(~drv)+
   labs(x="Number of Cylinders",y="Highway Miles per Gallon")+
   theme_classic()

  mpg2 %>% 
  ggplot(aes(x=cty, y=hwy,colour=drv)) + 
  geom_point()+
   facet_grid(drv~.)+
   labs(x="Number of Cylinders",y="Highway Miles per Gallon")+
   theme_classic()

Lets do some lines on all these points. For this we can use geom_smooth() that creates a loess model around our points. We can also define the number of columns or rows if we use facet_wrap rather than facet_grid().

  mpg2 %>% 
  ggplot(aes(x=cty, y=hwy,colour=drv)) + 
  geom_point()+
  geom_smooth()+
   facet_wrap(~drv,nrow=2)+
   labs(x="Number of Cylinders",y="Highway Miles per Gallon")+
   theme_classic()
`geom_smooth()` using method = 'loess' and formula = 'y ~ x'

  mpg2 %>% 
  ggplot(aes(x=cty, y=hwy,colour=drv)) + 
  geom_point()+
  geom_smooth()+
   facet_wrap(~drv,ncol=1)+
   labs(x="Number of Cylinders",y="Highway Miles per Gallon")+
   theme_classic()
`geom_smooth()` using method = 'loess' and formula = 'y ~ x'

 mpg2 %>% 
  ggplot(aes(x=cty, y=hwy,colour=drv)) + 
  geom_point()+
  geom_smooth()+
   facet_wrap(~drv,ncol=3)+
   labs(x="Number of Cylinders",y="Highway Miles per Gallon")+
   theme_classic()
`geom_smooth()` using method = 'loess' and formula = 'y ~ x'

Patchwork

Okay so maybe we want to look at a couple different associations in our data but without having related axes across the plots. To do this with patchwork we can save each plot as an object then print them. We can use + to add other objects to out ‘patchwork’ and build up layouts with () and /, or for more complex layouts we can use a few methods using the function plot_layout() from patchwork.

library(patchwork)


p1<-mpg2 %>% 
  ggplot(aes(x=cty, y=hwy,colour=drv)) + 
  geom_point()+
  geom_smooth()+
   labs(x="Number of Cylinders",y="Highway Miles per Gallon")+
   theme_classic()

p2<-mpg2 %>% 
  ggplot(aes(x=as.factor(year),fill=class)) + 
  geom_bar(position = "dodge2")+
   labs(x="Year",y="Number of Models")+
   theme_classic()

Simple Layouts

p1+p2
`geom_smooth()` using method = 'loess' and formula = 'y ~ x'

p1/p2
`geom_smooth()` using method = 'loess' and formula = 'y ~ x'

You can also reuse plots as you like.

(p1+p1+p2)/p2
`geom_smooth()` using method = 'loess' and formula = 'y ~ x'

So to make some fairly complicated plot layouts we can use brackets (), slashes / and pluses +. With a slash denoting a new line.

(p1+p2+p2)/p2/(p2+p1)
`geom_smooth()` using method = 'loess' and formula = 'y ~ x'

We can also use some helper functions to tidy our plots up. If for example we have repeated legends across our plots we can collect our legends or ‘guides’.

(p1+p2+p2)/p2/(p2+p1)+plot_layout(guides="collect")
`geom_smooth()` using method = 'loess' and formula = 'y ~ x'

As the plots were made with ggplot2 we can also edit the theme of all of them together. To do this we use an ampersand & in our patchwork layout.

(p1+p2+p2)/p2/(p2+p1)+
  plot_layout(guides="collect")& 
  theme(axis.title.x = element_text(size=20),
        axis.title.y = element_text(size=6))
`geom_smooth()` using method = 'loess' and formula = 'y ~ x'

Complex Layouts

We can also use some more advanced layout options for if for example we don’t want to fill the whole grid space. We create a layout object that has a grid spacing, which we can check by plotting, then we apply that layout to a basic patchwork. We need to use the area function for all the plots we want. We will try plot the same lay out as just above, but without stretching plots that are on a row on their own. In the area() function from patchwork (be careful with other packages with the same name function - you can make sure it is correct by using patchwork::area() ) we have four arguments for the top (t), the left (l), the bottom (b) and the right (r). We can put any non-negative numbers in these to create any array of plots.

layout<-c(
  area(t=1,l=1,b=1,r=1),
  area(t=1,l=2,b=1,r=2),
  area(t=1,l=3,b=1,r=3),
  area(t=2,l=2,b=2,r=2),
  area(t=3,l=1,b=3,r=1),
  area(t=3,l=3,b=3,r=3)
)

plot(layout)

We can now apply this layout with plot_layout() to a basic list of added up plots.

p1+p2+p2+p2+p2+p1+
  plot_layout(guides="collect",design = layout)& 
  theme(axis.title.x = element_text(size=20),
        axis.title.y = element_text(size=6))
`geom_smooth()` using method = 'loess' and formula = 'y ~ x'

As patchwork is happy with a ggplot2 object, we could even combine patchworks if we save one patchwork as a global object and added another ggplot to a new patchwork.

patch<-p1+p2+p2+p2+p2+p1+
  plot_layout(guides="collect",design = layout)& 
  theme(axis.title.x = element_text(size=20),
        axis.title.y = element_text(size=6))


p1/patch
`geom_smooth()` using method = 'loess' and formula = 'y ~ x'

Using layout and its area function can allow us to create more and more complex arrangements, with and without overlaps. We can also add plot labels to help us refer to the plots in the legend. We can use plot_annotation() with tag_levels=“a” for a, b, c etc or “1” for numbers.

layout2<-c(
  area(t=1,l=1,b=5,r=5),
  area(t=1,l=2,b=1,r=2),
  area(t=1,l=3,b=1,r=3),
  area(t=2,l=2,b=2,r=2),
  area(t=3,l=1,b=3,r=1),
  area(t=3,l=6,b=5,r=9)
)

plot(layout2)

p1+p2+p2+p2+p2+p1+
  plot_layout(guides="collect",design = layout2)+
  plot_annotation(tag_levels = "a")& 
  theme(axis.title.x = element_text(size=20),
        axis.title.y = element_text(size=6))
`geom_smooth()` using method = 'loess' and formula = 'y ~ x'

These don’t look great now but the concept can be really useful for displaying lots of information and especially when making maps or plots where want to zoom in to a certain region to highlight some element of it. Lets get the lakers data from the lubridate package (it is already loaded in tidyverse). We will look at basketball shots on the court with their x and y cordinates, and whether they were missed or made. Let’s make our first plot and build it up slowly.

data("lakers")

## Default ggplot facet plot

lakers %>% 
  filter(etype=="shot") %>% 
  drop_na() %>% 
ggplot()+
  geom_point(aes(x=x,y=y),
             alpha=0.4)+
  facet_wrap(~result)

## Lets fix coordinates and remove axis info

lakers %>% 
  filter(etype=="shot") %>% 
  drop_na() %>% 
ggplot()+
  geom_point(aes(x=x,y=y,colour=as.factor(points),
                 shape=as.factor(points)),
             alpha=0.4)+
  facet_wrap(~result)+
  coord_fixed()+
  theme_classic()+
  theme(axis.text = element_blank(),
        axis.ticks = element_blank(),
        axis.title = element_blank())

## Lets add a Hoop and Make the Legend a bit nicer plus different colours
## We shall also add a square to show where our zoomed in plot will be.
## To do this we select only the one shots made facet.

lakers %>% 
  filter(etype=="shot") %>% 
  drop_na() %>%
  mutate(hoop_x=25,
         hoop_y=0,
         result=case_when(result=="made"~"Shot Made",
                          result=="missed"~"Shot Missed")) %>% 
ggplot()+
  geom_segment(aes(x=hoop_x,y=hoop_y,xend=hoop_x,yend=-10))+
  geom_point(aes(x=hoop_x,y=hoop_y),
             shape=21,size=6,colour="darkorange",fill="white")+
  geom_point(aes(x=x,y=y,colour=as.factor(points),
                 shape=as.factor(points)),
             alpha=0.4)+
  geom_rect(data=. %>% filter(result=="Shot Made"), ## We can use a dot to show that we are using the data already in the ggplot
            aes(xmin=-2,xmax=max(x)+2,ymin=-10,ymax=45),colour="orange",fill=NA)+
  facet_wrap(~result)+
  labs(shape="Points",colour="Points")+
  coord_fixed(ylim=c(1,NA))+
  scale_colour_manual(values=c("red","darkcyan","gold"))+
  theme_classic()+
  theme(axis.text = element_blank(),
        axis.ticks = element_blank(),
        axis.title = element_blank())

## we will also add an arrow into the plot to show where the new zoom plot will be.

lakers %>% 
  filter(etype=="shot") %>% 
  drop_na() %>%
  mutate(hoop_x=25,
         hoop_y=0,
         result=case_when(result=="made"~"Shot Made",
                          result=="missed"~"Shot Missed")) %>% 
ggplot()+
  geom_segment(data=. %>% filter(result=="Shot Made"), ## We use the same trick from above to only put arrow on one facet.
               aes(x = 25, y = 45, xend = 25, yend = 50),
                  arrow = arrow(length = unit(0.5, "cm")),
               colour="darkorange")+
  geom_segment(aes(x=hoop_x,y=hoop_y,xend=hoop_x,yend=-10))+
  geom_point(aes(x=hoop_x,y=hoop_y),
             shape=21,size=6,colour="darkorange",fill="white")+
  geom_point(aes(x=x,y=y,colour=as.factor(points),
                 shape=as.factor(points)),
             alpha=0.4)+
  geom_rect(data=. %>% filter(result=="Shot Made"),
            aes(xmin=-2,xmax=max(x)+2,ymin=-10,ymax=45),colour="orange",fill=NA)+
  facet_wrap(~result)+
  labs(shape="Points",colour="Points")+
  coord_fixed(ylim=c(1,NA))+
  scale_colour_manual(values=c("red","darkcyan","gold"))+
  theme_classic()+
  theme(axis.text = element_blank(),
        axis.ticks = element_blank(),
        axis.title = element_blank())

## Okay Lets save this one to our global environment

BigPlot<-lakers %>% 
  filter(etype=="shot") %>% 
  drop_na() %>%
  mutate(hoop_x=25,
         hoop_y=0,
         result=case_when(result=="made"~"Shot Made",
                          result=="missed"~"Shot Missed")) %>% 
ggplot()+
  geom_segment(data=. %>% filter(result=="Shot Made"), 
               aes(x = 25, y = 45, xend = 25, yend = 50),
                  arrow = arrow(length = unit(0.5, "cm")),
               colour="darkorange")+
  geom_segment(aes(x=hoop_x,y=hoop_y,xend=hoop_x,yend=-10))+
  geom_point(aes(x=hoop_x,y=hoop_y),
             shape=21,size=6,colour="darkorange",fill="white")+
  geom_point(aes(x=x,y=y,colour=as.factor(points),
                 shape=as.factor(points)),
             alpha=0.4)+
  geom_rect(data=. %>% filter(result=="Shot Made"),
            aes(xmin=-2,xmax=max(x)+2,ymin=-10,ymax=45),colour="orange",fill=NA)+
  facet_wrap(~result)+
  labs(shape="Points",colour="Points")+
  coord_fixed(ylim=c(1,NA))+
  scale_colour_manual(values=c("red","darkcyan","gold"))+
  theme_classic()+
  theme(axis.text = element_blank(),
        axis.ticks = element_blank(),
        axis.title = element_blank())

So we have our background plot showing all the data and information, now lets zoom in to the area where shots are being made. Lots of points are overlaid here so we could try look at the density of points spatially to see if there was a pattern in the made shots. We use geom_hex() and apply a log transformation to get a heat map.

lakers %>% 
  filter(etype=="shot" & result=="made") %>% 
  drop_na() %>%
  mutate(hoop_x=25,
         hoop_y=0) %>% 
ggplot()+
  geom_segment(aes(x=hoop_x,y=hoop_y,xend=hoop_x,yend=-10))+
  geom_point(aes(x=hoop_x,y=hoop_y),
             shape=21,size=6,colour="darkorange",fill="white")+
  geom_hex(aes(x=x,y=y,fill = after_stat(log(count))),bins=30)+
  scale_fill_viridis_c()+
  labs(fill="Number of Made\nShots: log(count)")+
  coord_fixed(ylim=c(0,NA))+
  theme_classic()+
  theme(axis.text = element_blank(),
        axis.ticks = element_blank(),
        axis.title = element_blank())

## Again lets save it as a global object

ZoomedInHex<-lakers %>% 
  filter(etype=="shot" & result=="made") %>% 
  drop_na() %>%
  mutate(hoop_x=25,
         hoop_y=0) %>% 
ggplot()+
  geom_segment(aes(x=hoop_x,y=hoop_y,xend=hoop_x,yend=-10))+
  geom_point(aes(x=hoop_x,y=hoop_y),
             shape=21,size=6,colour="darkorange",fill="white")+
  geom_hex(aes(x=x,y=y,fill = after_stat(log(count))),bins=30)+
  scale_fill_viridis_c()+
  labs(fill="Number of Made\nShots: log(count)")+
  coord_fixed(ylim=c(-2,NA))+
  theme_classic()+
  theme(axis.text = element_blank(),
        axis.ticks = element_blank(),
        axis.title = element_blank())

Finally lets sort out the layout we want to then combine these two saved plots.

layout3<-c(
  area(t=1,l=1,b=20,r=20),
  area(t=2,l=3,b=8,r=9)
)

plot(layout3)

BigPlot+ZoomedInHex+
  plot_layout(design = layout3)+
  plot_annotation(tag_levels = "a")

This is okay, still not great. We shall see if we can make a nice in the next tutorial.