Comparing and Ensembling Machine Learning Models

Introduction
R
Machine Learning
Stats
Random Forest
XGBoost
SVM
KNN
Building different Models and Intercomparing, and then Combining into an Ensemble
Published

January 9, 2024

Preparing Board Games

Lets take some tidy tuesday data (either with the package or with the code) https://github.com/rfordatascience/tidytuesday/blob/master/data/2022/2022-01-25/readme.md. Here we will look at some data on board games and try and predict a board games rating based on some of its information.

#install.packages("tidytuesdayR")
#library(tidytuesdayR)
#


library(tidyverse)
library(tidymodels)
library(stacks)
library(ggpointdensity)
library(viridis)

#tt_data <- tt_load("2022-01-25")

ratings <- read_csv("https://raw.githubusercontent.com/rfordatascience/tidytuesday/master/data/2022/2022-01-25/ratings.csv")
Rows: 21831 Columns: 10
── Column specification ────────────────────────────────────────────────────────
Delimiter: ","
chr (3): name, url, thumbnail
dbl (7): num, id, year, rank, average, bayes_average, users_rated

ℹ Use `spec()` to retrieve the full column specification for this data.
ℹ Specify the column types or set `show_col_types = FALSE` to quiet this message.
details <- read_csv("https://raw.githubusercontent.com/rfordatascience/tidytuesday/master/data/2022/2022-01-25/details.csv")
Rows: 21631 Columns: 23
── Column specification ────────────────────────────────────────────────────────
Delimiter: ","
chr (10): primary, description, boardgamecategory, boardgamemechanic, boardg...
dbl (13): num, id, yearpublished, minplayers, maxplayers, playingtime, minpl...

ℹ Use `spec()` to retrieve the full column specification for this data.
ℹ Specify the column types or set `show_col_types = FALSE` to quiet this message.
ratings_joined <- ratings %>%
  left_join(details, by = "id") %>% 
  filter(!yearpublished%in%NA) %>% 
  select(id,average,yearpublished,minplayers,maxplayers,minage,playingtime,minplaytime,maxplaytime)

Preliminary Data Exploration

Lets look at ratings of board games.

library(tidyverse)
library(tidymodels)
library(stacks)
library(ggpointdensity)
library(viridis)

ggplot(ratings_joined,aes(average))+
  geom_histogram()+
  theme_classic()
`stat_bin()` using `bins = 30`. Pick better value with `binwidth`.

Lets compare the minimum and maximum number of players for the game with its rating.

ggplot(ratings_joined,aes(average,minplayers))+
  geom_point()+
  theme_classic()

ggplot(ratings_joined,aes(average,maxplayers))+
  geom_point()+
  scale_y_sqrt()+
  theme_classic()

There are some interesting things going on here. But lets make some models then we can tease out some of these predictors.

Pre Processing

Data Splitting

init<-initial_split(ratings_joined,strata = average)

train<-training(init)

folds<-vfold_cv(train,strata = average)

test<-testing(init)

Create Recipe

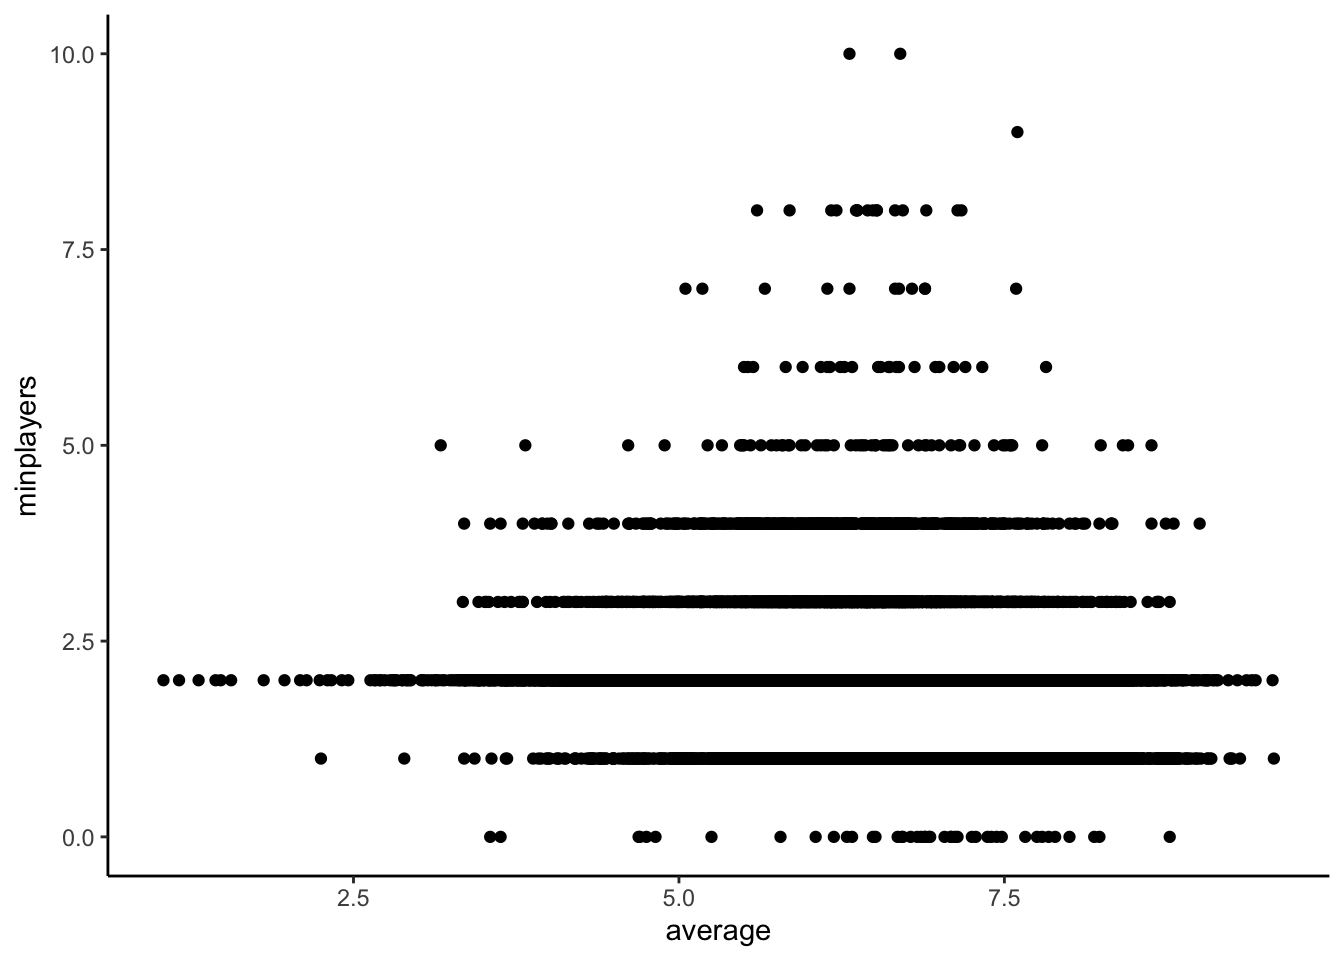
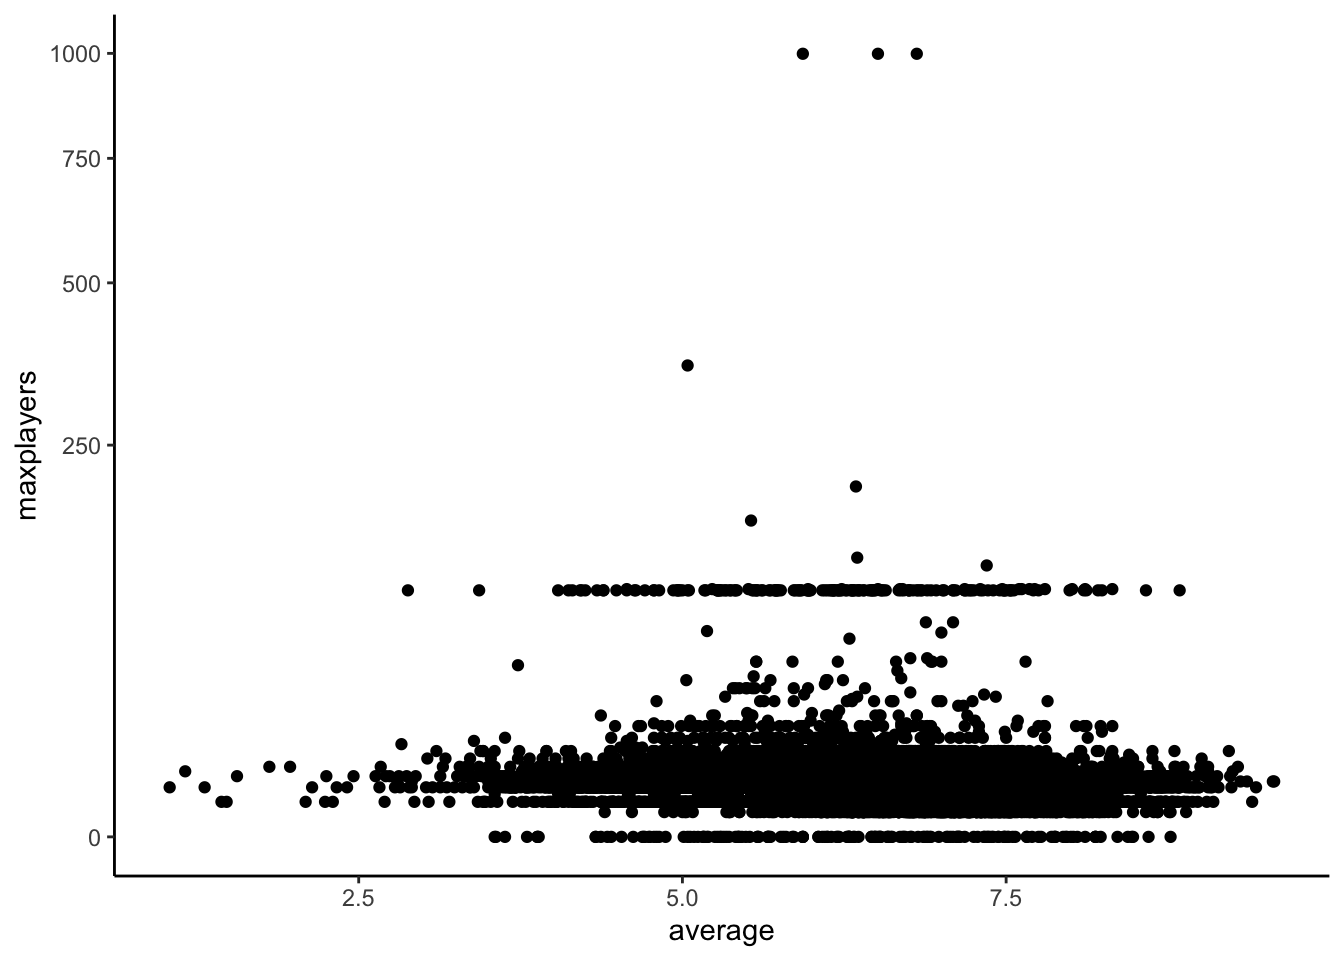
First we want to create a recipe that takes all columns (apart from id) to predict the average ranking. We also square root transform max players as some have huge max players.

recipe<-recipe(average~.,data=train) %>% 
  update_role(id,new_role="id") %>% 
  step_sqrt(maxplayers, skip = TRUE)

Create Model Specification

This is the first step where we choose the models we will compare. Lets do a glm, random forest, XGBoost, SVM and KNN.

glm_spec<-linear_reg(
  penalty = tune(), 
  mixture = tune()) %>% 
  set_mode("regression")%>%
  set_engine("glmnet")

rf_spec<- rand_forest(
  mtry = tune(),
  trees = tune(),
  min_n = tune()
) %>%
  set_mode("regression") %>%
  set_engine("ranger")

xgboost_spec<-boost_tree(
    trees = tune(),
    mtry = tune(),
    min_n = tune(),
    learn_rate = tune()
  ) %>%
  set_mode("regression")%>%
  set_engine("xgboost") 

# install.packages("kknn")
# install.packages("kernlab")

svm_spec<-  svm_rbf(
  cost = tune(), 
  rbf_sigma = tune()
  ) %>%
  set_mode("regression") %>%
  set_engine("kernlab")

knn_spec<-nearest_neighbor(neighbors = tune())%>%
  set_mode("regression") %>% 
  set_engine("kknn")

Model Hyper Parameter Tuning

So we could train each of these models as separate workflows then assess hyper parameter tuning as follows.

library(tidymodels)

glm_wf<-workflow() %>%
  add_recipe(recipe) %>%
  add_model(glm_spec)


tune_res_glm <- tune_grid(
  glm_wf,
  resamples = folds,
  grid = 5
)

tune_res_glm %>%
  collect_metrics() %>%
  filter(.metric == "rmse") %>%
  select(mean, penalty, mixture) %>%
  pivot_longer(penalty:mixture,
    values_to = "value",
    names_to = "parameter"
  ) %>%
  ggplot(aes(value, mean, color = parameter)) +
  geom_point(show.legend = FALSE) +
  facet_wrap(~parameter, scales = "free_x") +
  labs(x = NULL, y = "RMSE")+
  theme_classic()

But we will be comparing lots of specs of models so lets make a workflowset and then do the same but with lots of trained models. This will take a long time, so i set the grid to be just 5, really it should be set to around 10, or you can use other methods other than grid search. We will also add (using option_add()) a control to the grid being used and the metric to be assessed (this will be necessary when we want to ensemble the models).

metric <- metric_set(rmse)

set.seed(234)

doParallel::registerDoParallel()

all_wf<-workflow_set(
  list(recipe),
  list(glm_spec,
       rf_spec,
       xgboost_spec,
       svm_spec,
       knn_spec)) %>%
  option_add(
    control = control_stack_grid(),
    metrics = metric
  )

all_res<- all_wf %>% 
  workflow_map(
    resamples=folds,
    grid=10
  )
i Creating pre-processing data to finalize unknown parameter: mtry

Once that finishes running we can compare between all the tuned models.

autoplot(
   all_res,
   rank_metric = "rmse",  # <- how to order models
   metric = "rmse",       # <- which metric to visualize
   select_best = TRUE     # <- one point per workflow
) +
   geom_text(aes(y = mean - 0.075, label = wflow_id), angle = 90, hjust = 1) +
   lims(y = c(0.5, 1)) +
   theme_classic()

Select Best Model

Lets select a good model, then see how well it performs on predicting the test data. All models performed fairly well but lets select the recipe_boost_tree model. The best_results object provides us the ‘best’ hyper parameter values for this model framework (the best hyper parameters for the boosted tree models looked at). This is based on a very small amount of tests here, in reality we should use many more combinations of hyper parameters to test the best ones.

best_results <- all_res %>% 
   extract_workflow_set_result("recipe_boost_tree") %>% 
   select_best(metric = "rmse")

best_results
# A tibble: 1 × 5
   mtry trees min_n learn_rate .config              
  <int> <int> <int>      <dbl> <chr>                
1     2  1333    39    0.00850 Preprocessor1_Model02

Assess Ability of ‘Best’ Model

Now lets combine these hyperparrameter values with the workflow, finalise the model and then fit to the initial split of our data. Then we can collect the metrics when this model was applied to the test dataset.

boosting_test_results <- 
   all_res %>% 
   extract_workflow("recipe_boost_tree") %>% 
   finalize_workflow(best_results) %>% 
   last_fit(split = init)
  
collect_metrics(boosting_test_results)
# A tibble: 2 × 4
  .metric .estimator .estimate .config             
  <chr>   <chr>          <dbl> <chr>               
1 rmse    standard       0.720 Preprocessor1_Model1
2 rsq     standard       0.408 Preprocessor1_Model1

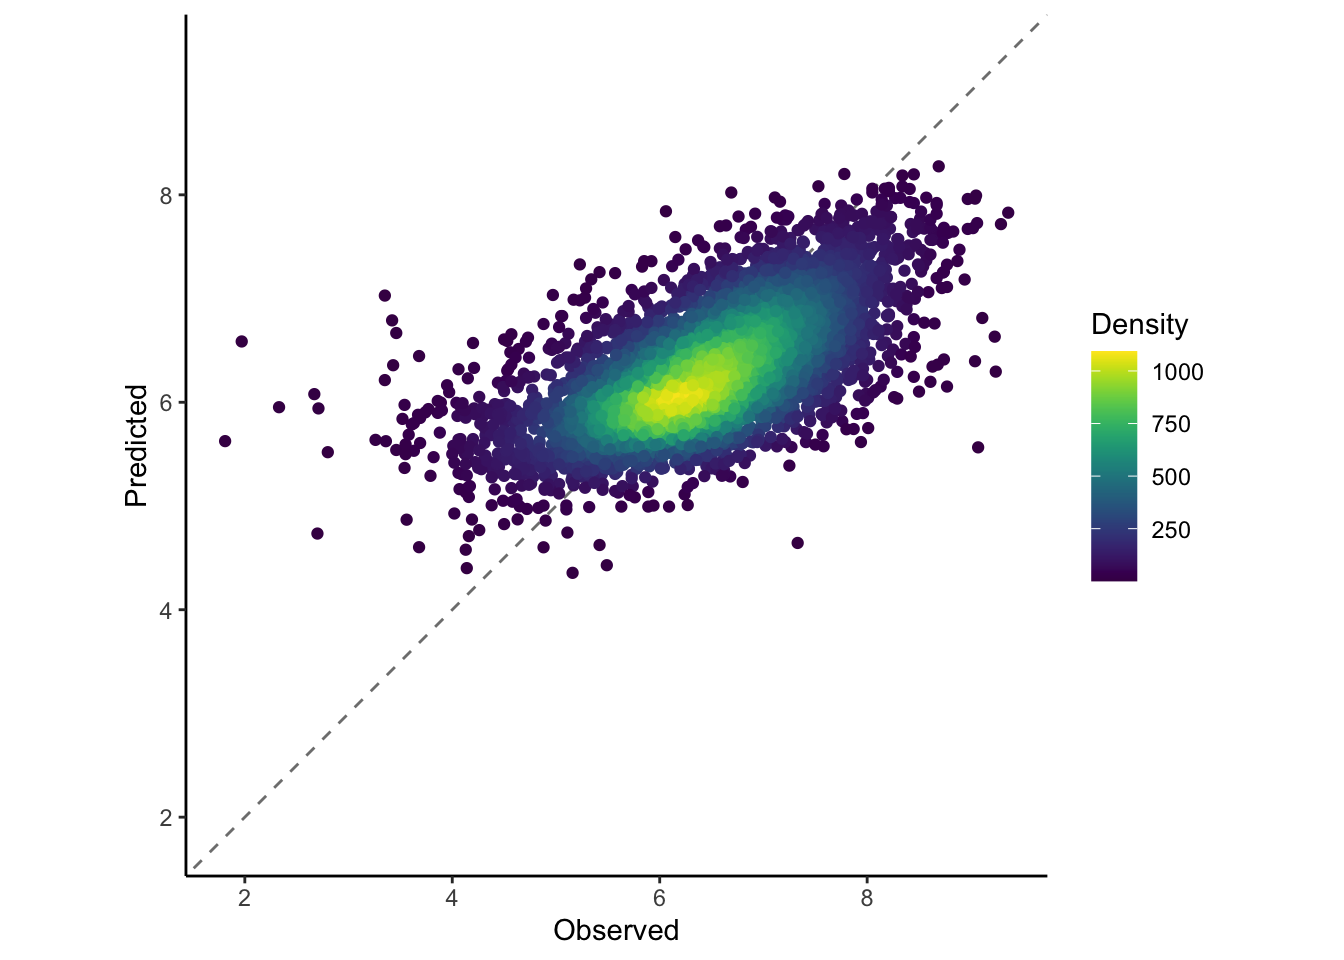
We can also plot the predicted verses the true results.

boosting_test_results %>% 
   collect_predictions() %>% 
   ggplot(aes(x = average, y = .pred)) + 
   geom_abline(colour = "gray50", linetype = 2) + 
   geom_pointdensity() + 
   coord_obs_pred()+
  scale_color_viridis() + 
   labs(x = "Observed", y = "Predicted",colour="Density")+
   theme_classic()

Ensemble All Models Together

After training all these different models and there could be a lot more, we may be losing predictive ability by only selecting the best one. Many researchers and ML practitioners that combining an ensemble of models will generally lead to better prediction ability. With the Stacks package in r we can easily stack or ensemble our models together.
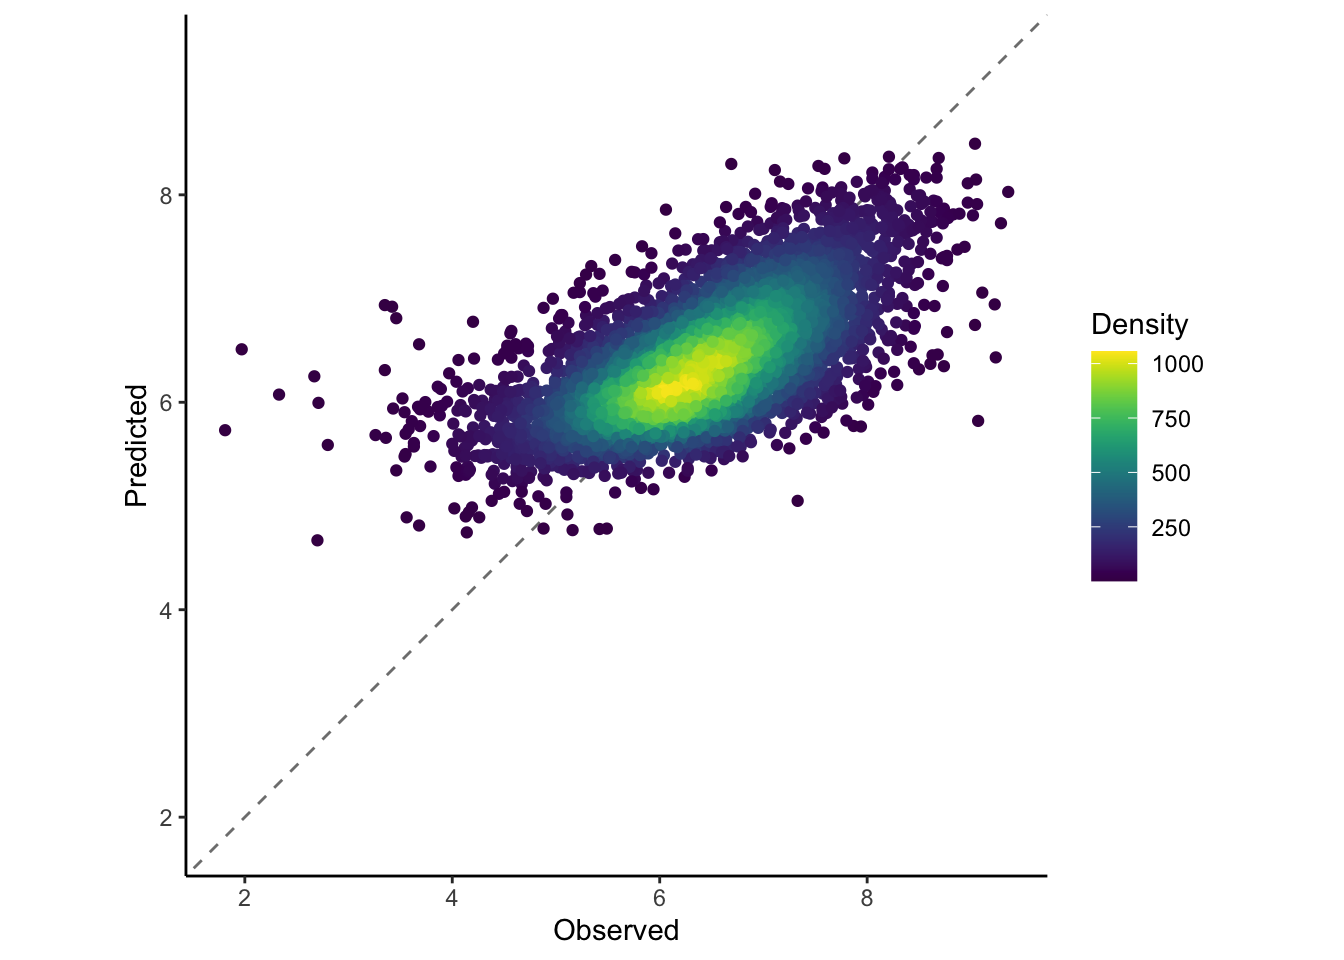
 all_stacked<-stacks() %>%
  add_candidates(all_res) %>%
  blend_predictions() %>%
  fit_members() 
 
stack_test_res <- test %>%
  bind_cols(predict(all_stacked, .))


stack_test_res %>% 
   ggplot(aes(x = average, y = .pred)) + 
   geom_abline(colour = "gray50", linetype = 2) + 
   geom_pointdensity() + 
   coord_obs_pred()+
  scale_color_viridis() + 
   labs(x = "Observed", y = "Predicted",colour="Density")+
   theme_classic()

Validation Metric

Earlier, our ‘best’ model produced an rmse of: 0.72, which is very good and our ensemble model created an rmse of: 0.695, which is almost identical but marginally better.