Loading required package: jpeg
Loading required package: BayesFactor
Loading required package: coda
Loading required package: Matrix

Attaching package: 'Matrix'

The following objects are masked from 'package:tidyr':

    expand, pack, unpack
Warning in .recacheSubclasses(def@className, def, env): undefined subclass
"ndiMatrix" of class "replValueSp"; definition not updated
************
Welcome to BayesFactor 0.9.12-4.5. If you have questions, please contact Richard Morey (richarddmorey@gmail.com).

Type BFManual() to open the manual.
************
Loading required package: circlize
========================================
circlize version 0.4.15
CRAN page: https://cran.r-project.org/package=circlize
Github page: https://github.com/jokergoo/circlize
Documentation: https://jokergoo.github.io/circlize_book/book/

If you use it in published research, please cite:
Gu, Z. circlize implements and enhances circular visualization
  in R. Bioinformatics 2014.

This message can be suppressed by:
  suppressPackageStartupMessages(library(circlize))
========================================

yarrr v0.1.5. Citation info at citation('yarrr'). Package guide at yarrr.guide()
Email me at Nathaniel.D.Phillips.is@gmail.com

Attaching package: 'yarrr'

The following object is masked from 'package:ggplot2':

    diamonds
data(diamonds)summary(diamonds)
     weight          clarity           color          value
 Min.   : 5.360   Min.   :0.4400   Min.   :2.00   Min.   :174.0
 1st Qu.: 8.598   1st Qu.:0.8900   1st Qu.:4.00   1st Qu.:184.0
 Median : 9.805   Median :1.0000   Median :5.00   Median :189.6
 Mean   : 9.901   Mean   :0.9996   Mean   :4.96   Mean   :189.4
 3rd Qu.:11.155   3rd Qu.:1.1200   3rd Qu.:6.00   3rd Qu.:194.9
 Max.   :14.270   Max.   :1.4400   Max.   :8.00   Max.   :206.4
Step One - Scienctific Model to Stats Model
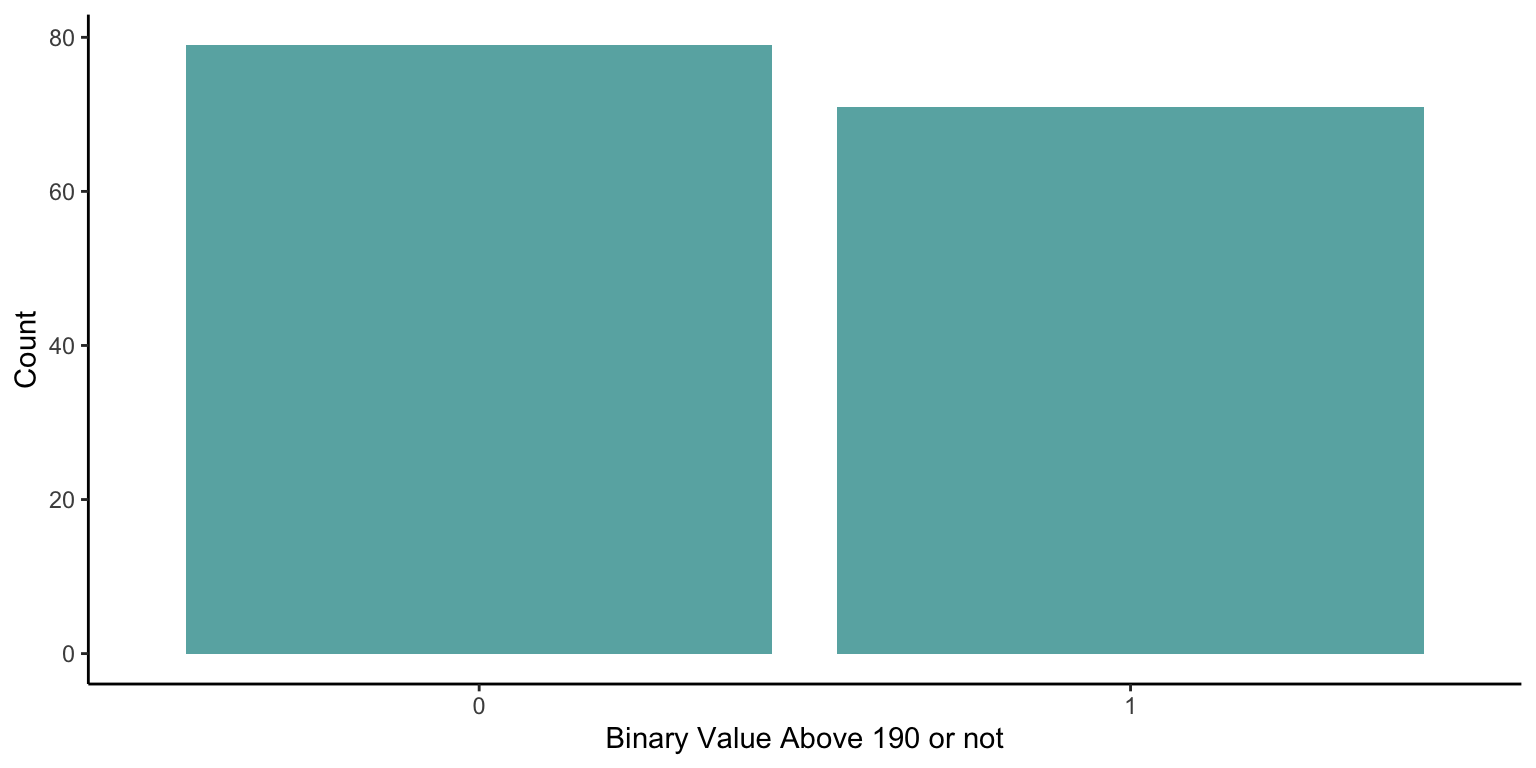
So we could model the actual diamond value but for this example we will split the value into high and low values (higher than 190 or lower than 190).
df_bin<-diamonds %>%mutate(binary=if_else(value>190,1,0))ggplot(df_bin,aes(x=as.factor(binary)))+geom_bar(fill="darkcyan",alpha=0.7)+labs(x="Binary Value Above 190 or not",y="Count")+theme_classic()
We imagine that the colour, weight and clarity will all influence the value of a diamond, thus we shall additively include each of these variables in the model.
Binary Value (above 190) ~ Clarity + Weight + Colour
Step Two - Resonse Variable Distribution
We created the response variable to be either 1 or 0. We therefore know that it is a binomial distribution but more specifically it is a Bernoulli distribution. For modelling in r the binomial distribution family is what is used.
Step Three - Organising Fixed Effects
Okay so lets look at our fixed effects, we will use density for continuous values (clarity and weight), while bars can show the counts for the integer Colour. Here colour is an ordinal integer, therefore we will model it as such. If we had Colour as a category (such as red, green, blue etc) we would want to convert it to be a factor for modelling as it would be more nominal.
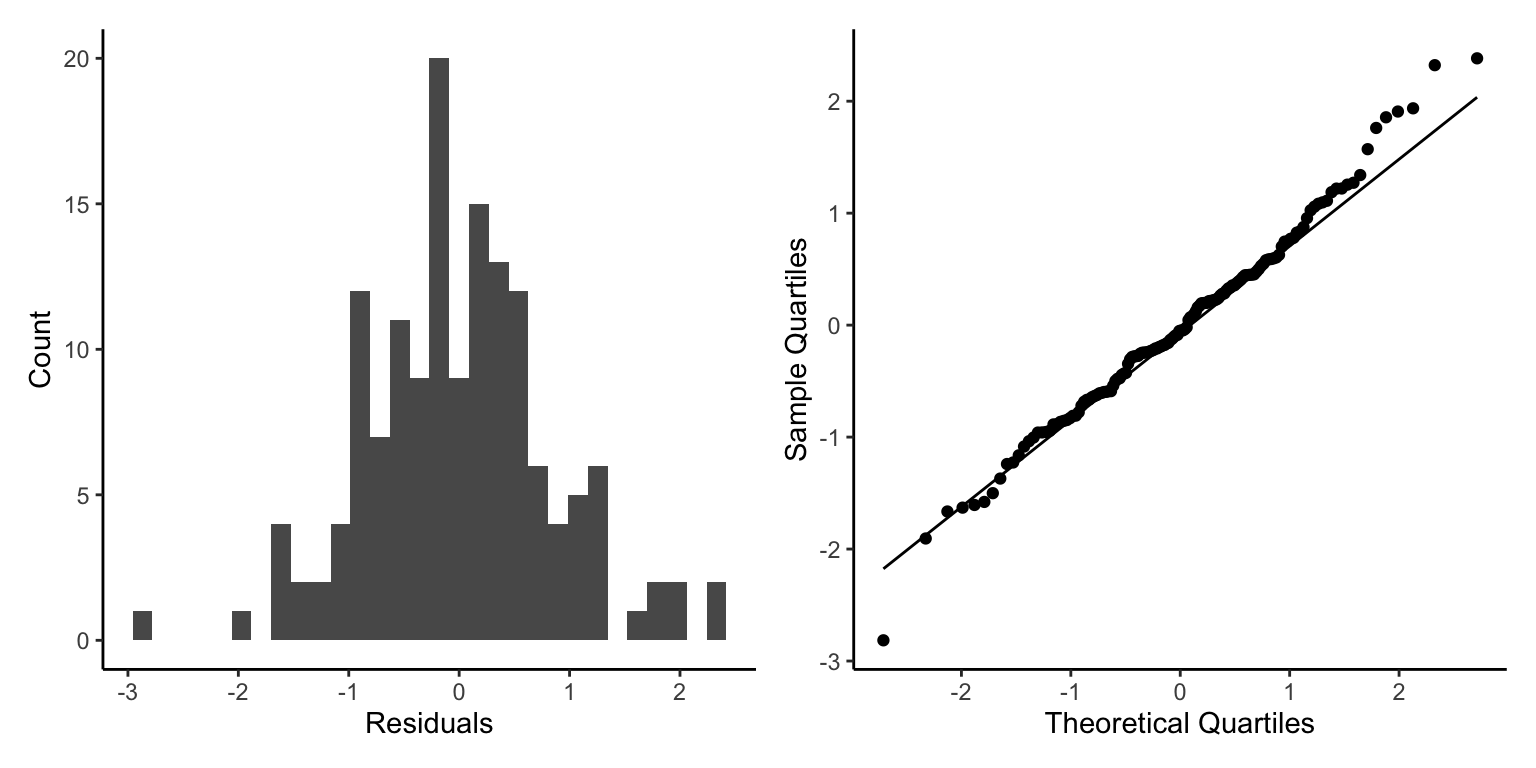
`stat_bin()` using `bins = 30`. Pick better value with `binwidth`.
Okay, here we have a different looking plot than before as the response variable is not continuous or integers. Therefore, homogeneity of residuals is less important, but normality of residuals is. Here we see that the qqnorm plot looks fairly good but high values are moving away from normality. Generally the model seems to fit well so we will interpret it.
summary(glm1)
Call:
glm(formula = binary ~ clarity + color + weight, family = "binomial",
    data = df_bin)

Coefficients:
            Estimate Std. Error z value Pr(>|z|)
(Intercept) -18.8009     3.4634  -5.428 5.69e-08 ***
clarity       9.2910     1.9629   4.733 2.21e-06 ***
color        -0.3836     0.2481  -1.547    0.122
weight        1.1251     0.1968   5.716 1.09e-08 ***
---
Signif. codes:  0 '***' 0.001 '**' 0.01 '*' 0.05 '.' 0.1 ' ' 1

(Dispersion parameter for binomial family taken to be 1)

    Null deviance: 207.52  on 149  degrees of freedom
Residual deviance: 106.67  on 146  degrees of freedom
AIC: 114.67

Number of Fisher Scoring iterations: 6
Lets write out the equation for the model, then we can use the values from the summary to create an equation for the model (the predict function will do this for us).
If we wanted to we could write out our model as this:
\[ Value \:Above \:190 \:(or \:Not) = Binomial(N, Pr)\]
Here our link function is slightly different again. This time it is a logit. This is effectively a way of converting a value to be a probability.
We can check this is the link function r is using here.
glm1$family$link
[1] "logit"
Step Five - Model Interpretation
Thankfully we don’t have to extract each \(\beta\) parameter from the summary table as R has useful functions that can do this for us! To do this we make simulated raw data with the same predictor variables in.
We then use the model to predict() the response variable based on those predictor variables.
Therefore, we make a data set with just Clarity, Color and Weight the same as our original data (be careful of spelling and capitalisation, R wants it identical).
The model then predicts the average Probability that a Diamond has a value over 190 based on its weight, color and clarity.
We can also tell the predict function to predict error (Standard Error here that we then convert to an approximation of the 95% confidence interval, we make sure these Upper and Lower confidence intervals don’t stray outside of 0 and 1).
Note that here I tell Predict that I want the fit to be returned on the response scale and not the link scale.
To make plotting easier I will set a Low, middle and high value for weight and color as clarity has the highest influence on diamond value.
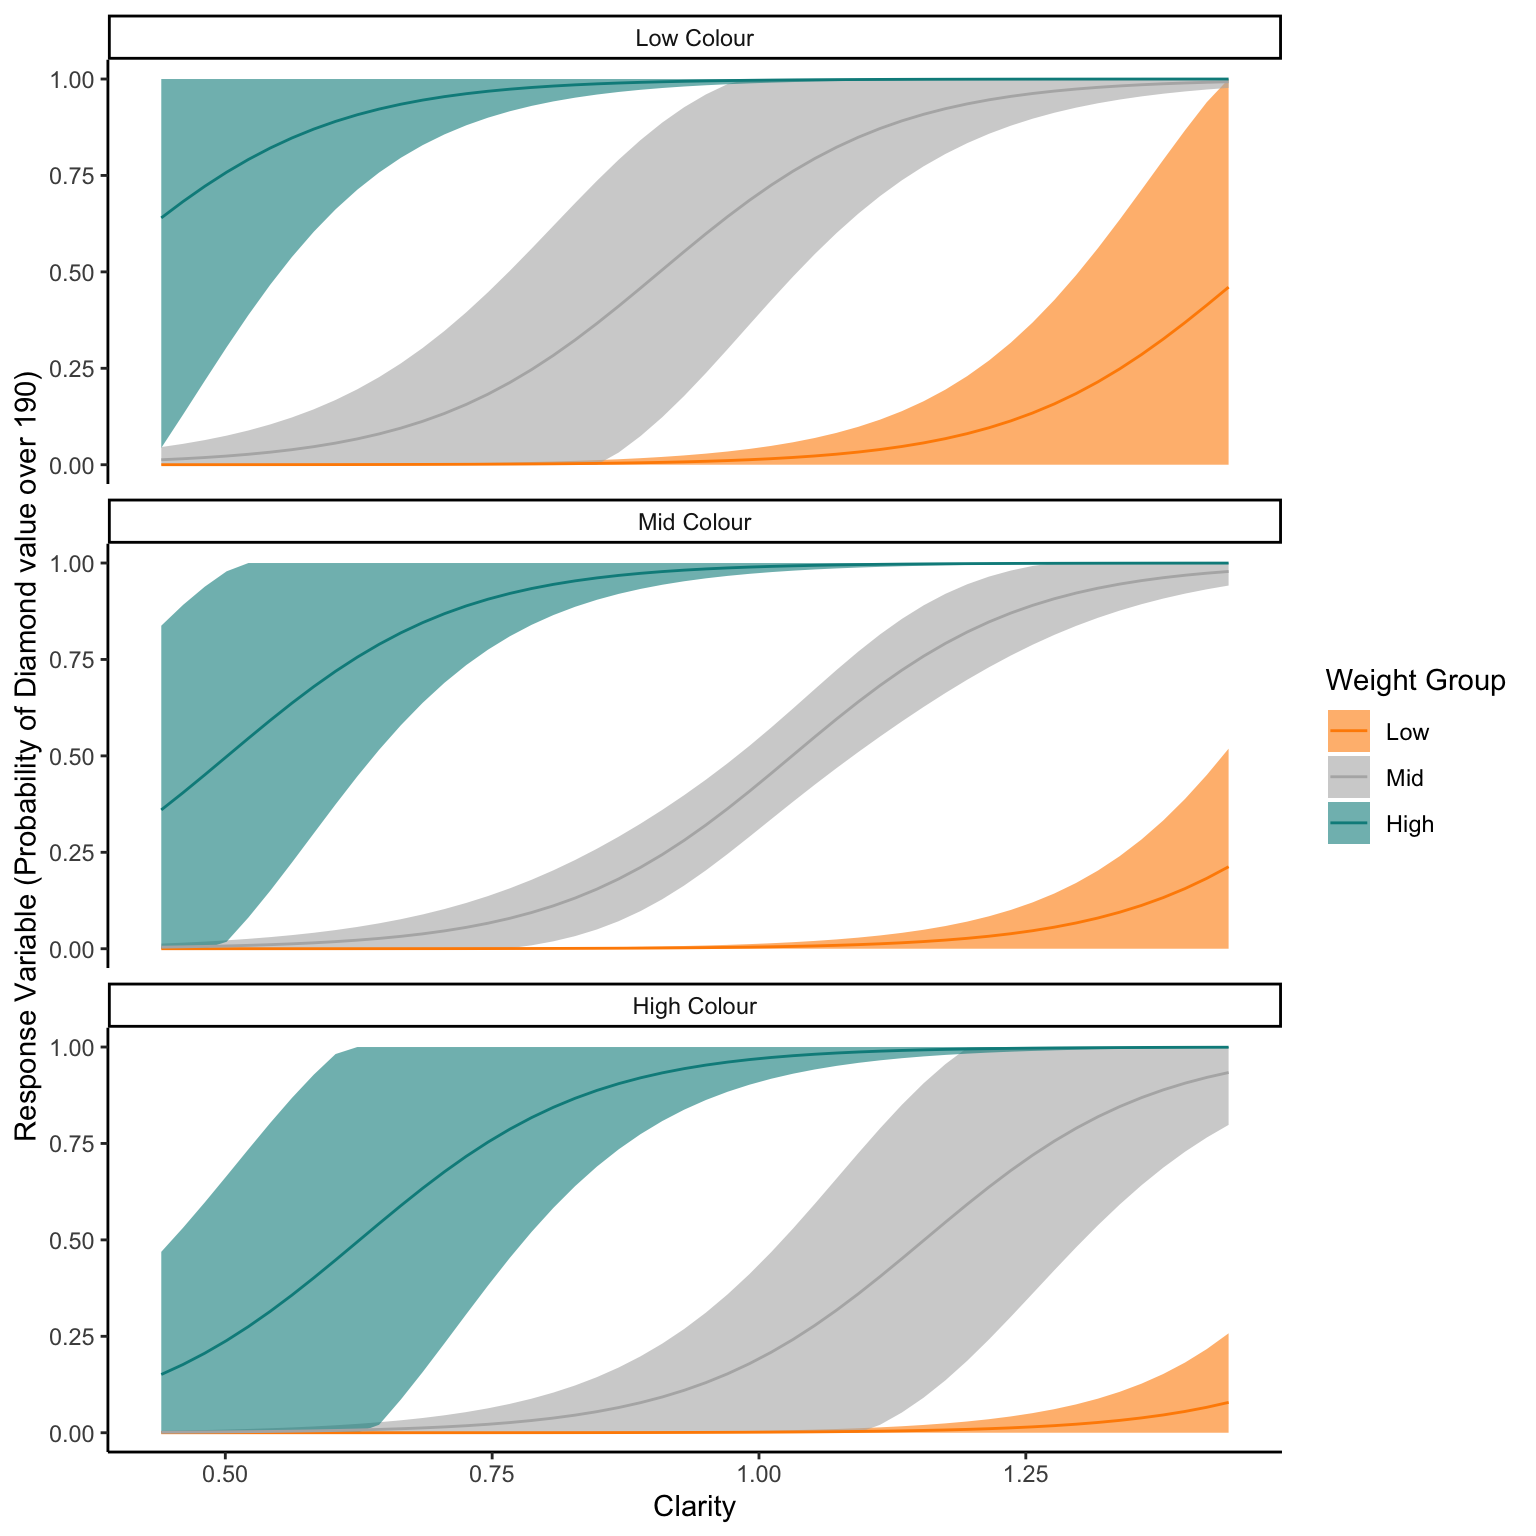
NewData_1<-expand.grid(weight=c(min(df_bin$weight),mean(df_bin$weight),max(df_bin$weight)),color=c(2,5,8),clarity=seq(min(df_bin$clarity),max(df_bin$clarity),length.out=50) ) %>%mutate(Weight_Group=factor(case_when(weight==min(df_bin$weight)~"Low", weight==mean(df_bin$weight)~"Mid", weight==max(df_bin$weight)~"High" ),levels=c("Low","Mid","High")),Color_Group=factor(case_when(color==2~"Low Colour", color==5~"Mid Colour", color==8~"High Colour" ),levels=c("Low Colour","Mid Colour","High Colour")))Pred<-predict(glm1,NewData_1,se.fit=TRUE,type="response")NewData<-NewData_1 %>%mutate(response=Pred$fit,se.fit=Pred$se.fit,Upr=response+(se.fit*1.96),Lwr=response-(se.fit*1.96),Upr=case_when(Upr>1~1,TRUE~Upr),Lwr=case_when(Lwr<0~0,TRUE~Lwr))ggplot(NewData)+geom_ribbon(aes(x=clarity,ymax=Upr,ymin=Lwr,fill=Weight_Group),alpha=0.6)+geom_line(aes(x=clarity,y=response,colour=Weight_Group))+facet_wrap(~Color_Group,ncol =1)+scale_colour_manual(values=c("darkorange","grey70","darkcyan"),)+scale_fill_manual(values=c("darkorange","grey70","darkcyan"))+labs(x="Clarity",y="Response Variable (Probability of Diamond value over 190)",fill="Weight Group",colour="Weight Group")+theme_classic()
From this graph we can see that Higher Weight class leads to a higher probability of a diamond being over 190 in value, likewise higher clarity leads to higher probability of high value. Colour seems to have less effect, although this is hard to see from this graph.
Now lets plot this model output over the raw values to see how well the model has worked. We will create new columns to show the Colour and Weight Group from the raw data. I will set arbitary cut offs, which could be interquartiles or thirds of the data. Or if there were specific values of interest these could be plotted on their own.
Raw_df_bin<-df_bin %>%mutate(Weight_Group=factor(case_when(weight<=7.5~"Low", weight>7.5& weight<12.5~"Mid", weight>=12.5~"High" ),levels=c("Low","Mid","High")),Color_Group=factor(case_when(color<=3~"Low Colour", color>3& color<7~"Mid Colour", color>=7~"High Colour" ),levels=c("Low Colour","Mid Colour","High Colour")))ggplot(NewData)+geom_ribbon(aes(x=clarity,ymax=Upr,ymin=Lwr,fill=Weight_Group),alpha=0.6)+geom_line(aes(x=clarity,y=response,colour=Weight_Group))+geom_point(data=Raw_df_bin,aes(x=clarity,y=binary,colour=Weight_Group))+facet_grid(Weight_Group~Color_Group)+scale_colour_manual(values=c("darkorange","grey70","darkcyan"),)+scale_fill_manual(values=c("darkorange","grey70","darkcyan"))+labs(x="Clarity",y="Response Variable (Probability of Diamond value over 190)",fill="Weight Group",colour="Weight Group")+theme_classic()
Some Caveats
Now this looks quite good, with more uncertainty where there are less values to influence the prediction. This is a very simplified model that is not taking into consideration many different factors, such as origin of diamond, the current diamond market etc. It is also a relatively small data set.
Data Loading Complex - Affairs
Lets create a more complex Binomial model. This data set is the frequency of affairs within the last year with their gender, age, yearsmarried, children, religiousness, education, occupation and self rating of marriage.
#install.packages("AER")library("AER")
Loading required package: car
Loading required package: carData
Attaching package: 'car'
The following object is masked from 'package:dplyr':

    recode
The following object is masked from 'package:purrr':

    some
Loading required package: lmtest
Loading required package: zoo
Attaching package: 'zoo'
The following objects are masked from 'package:base':

    as.Date, as.Date.numeric
Loading required package: sandwich
Loading required package: survival
data(Affairs, package="AER")summary(Affairs)
    affairs          gender         age         yearsmarried    children
 Min.   : 0.000   female:315   Min.   :17.50   Min.   : 0.125   no :171
 1st Qu.: 0.000   male  :286   1st Qu.:27.00   1st Qu.: 4.000   yes:430
 Median : 0.000                Median :32.00   Median : 7.000
 Mean   : 1.456                Mean   :32.49   Mean   : 8.178
 3rd Qu.: 0.000                3rd Qu.:37.00   3rd Qu.:15.000
 Max.   :12.000                Max.   :57.00   Max.   :15.000
 religiousness     education       occupation        rating
 Min.   :1.000   Min.   : 9.00   Min.   :1.000   Min.   :1.000
 1st Qu.:2.000   1st Qu.:14.00   1st Qu.:3.000   1st Qu.:3.000
 Median :3.000   Median :16.00   Median :5.000   Median :4.000
 Mean   :3.116   Mean   :16.17   Mean   :4.195   Mean   :3.932
 3rd Qu.:4.000   3rd Qu.:18.00   3rd Qu.:6.000   3rd Qu.:5.000
 Max.   :5.000   Max.   :20.00   Max.   :7.000   Max.   :5.000
Our response variable will be a summary of the affairs column for occurrence or not of an affair in the last year where affairs was how often someone engaged in extramarital sexual intercourse during the past year? 0 = none, 1 = once, 2 = twice, 3 = 3 times, 7 = 4–10 times, 12 = monthly, 12 = weekly, 12 = daily.
Step One - Scienctific Model to Stats Model
We will assess the frequency of affairs and whether someones gender, religiousness affects this value, we will also include yearsmarried and whether the pattern of yearsmarried changes depending having children or not.
This is a bit more complex model with some interacting fixed effects and additional additive fixed effects and can be written as:
Frequency of Affairs ~ Children*Yearsmarried + Gender + Religiousness
Step Two - Resonse Variable Distribution
As before there are only integer values for affairs or none in the last year. This type of data could be presented in a different way if we wanted but we will use this scale for now.
Step Three - Organising Fixed Effects
Lets check all our fixed effects. For numeric values we can assess their distribution, categorical we can see the number of samples and if it is relatively even. From the way our data has been stored, they are all ordered categories but r has read some as numeric values. This is why we code them as factors first. Gender and children are already factors. We could use the yearsmarried as a categry but we will use a numeric here. I will also do a bit of house keeping such as capitalising the factors (personal preference!).
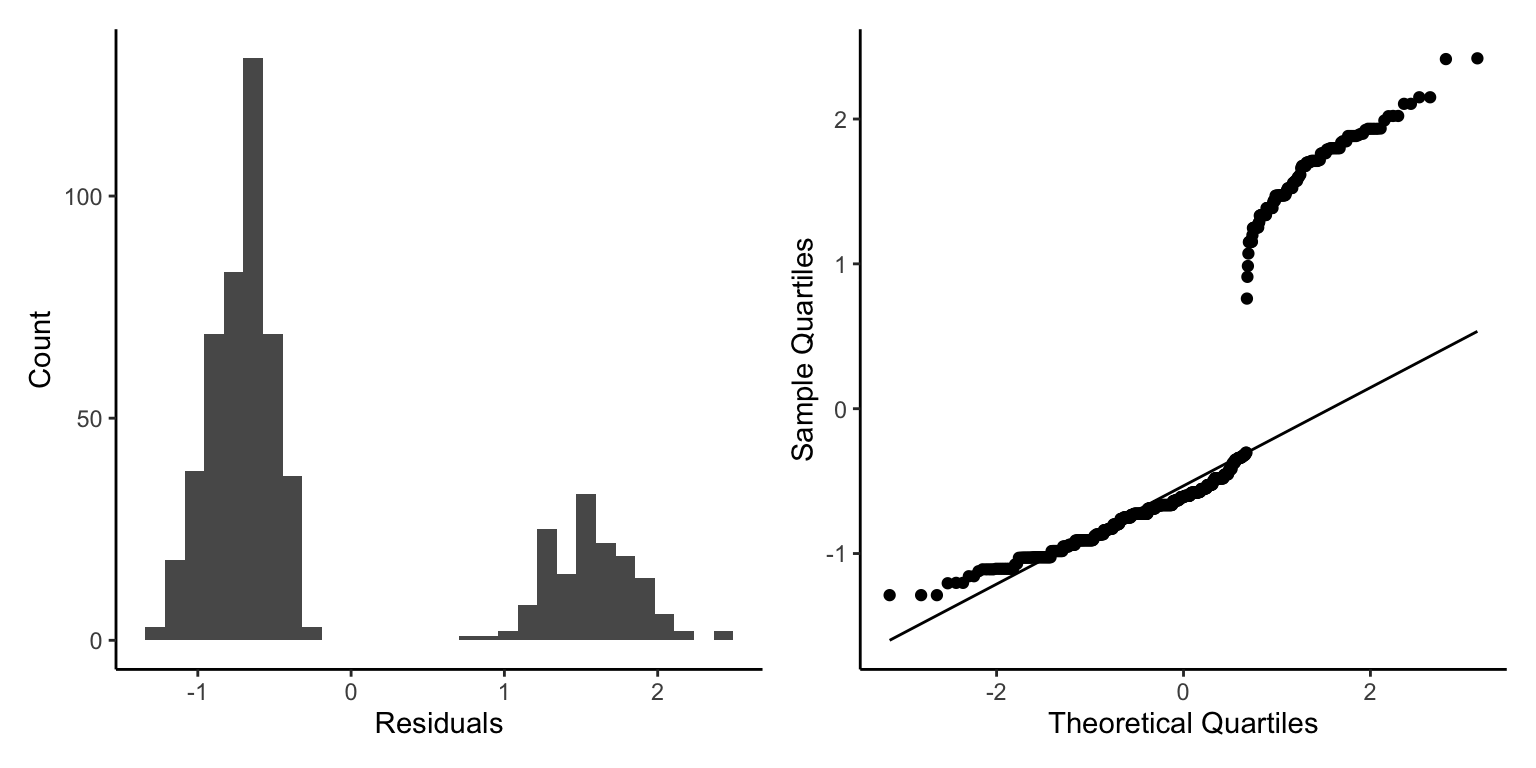
`stat_bin()` using `bins = 30`. Pick better value with `binwidth`.
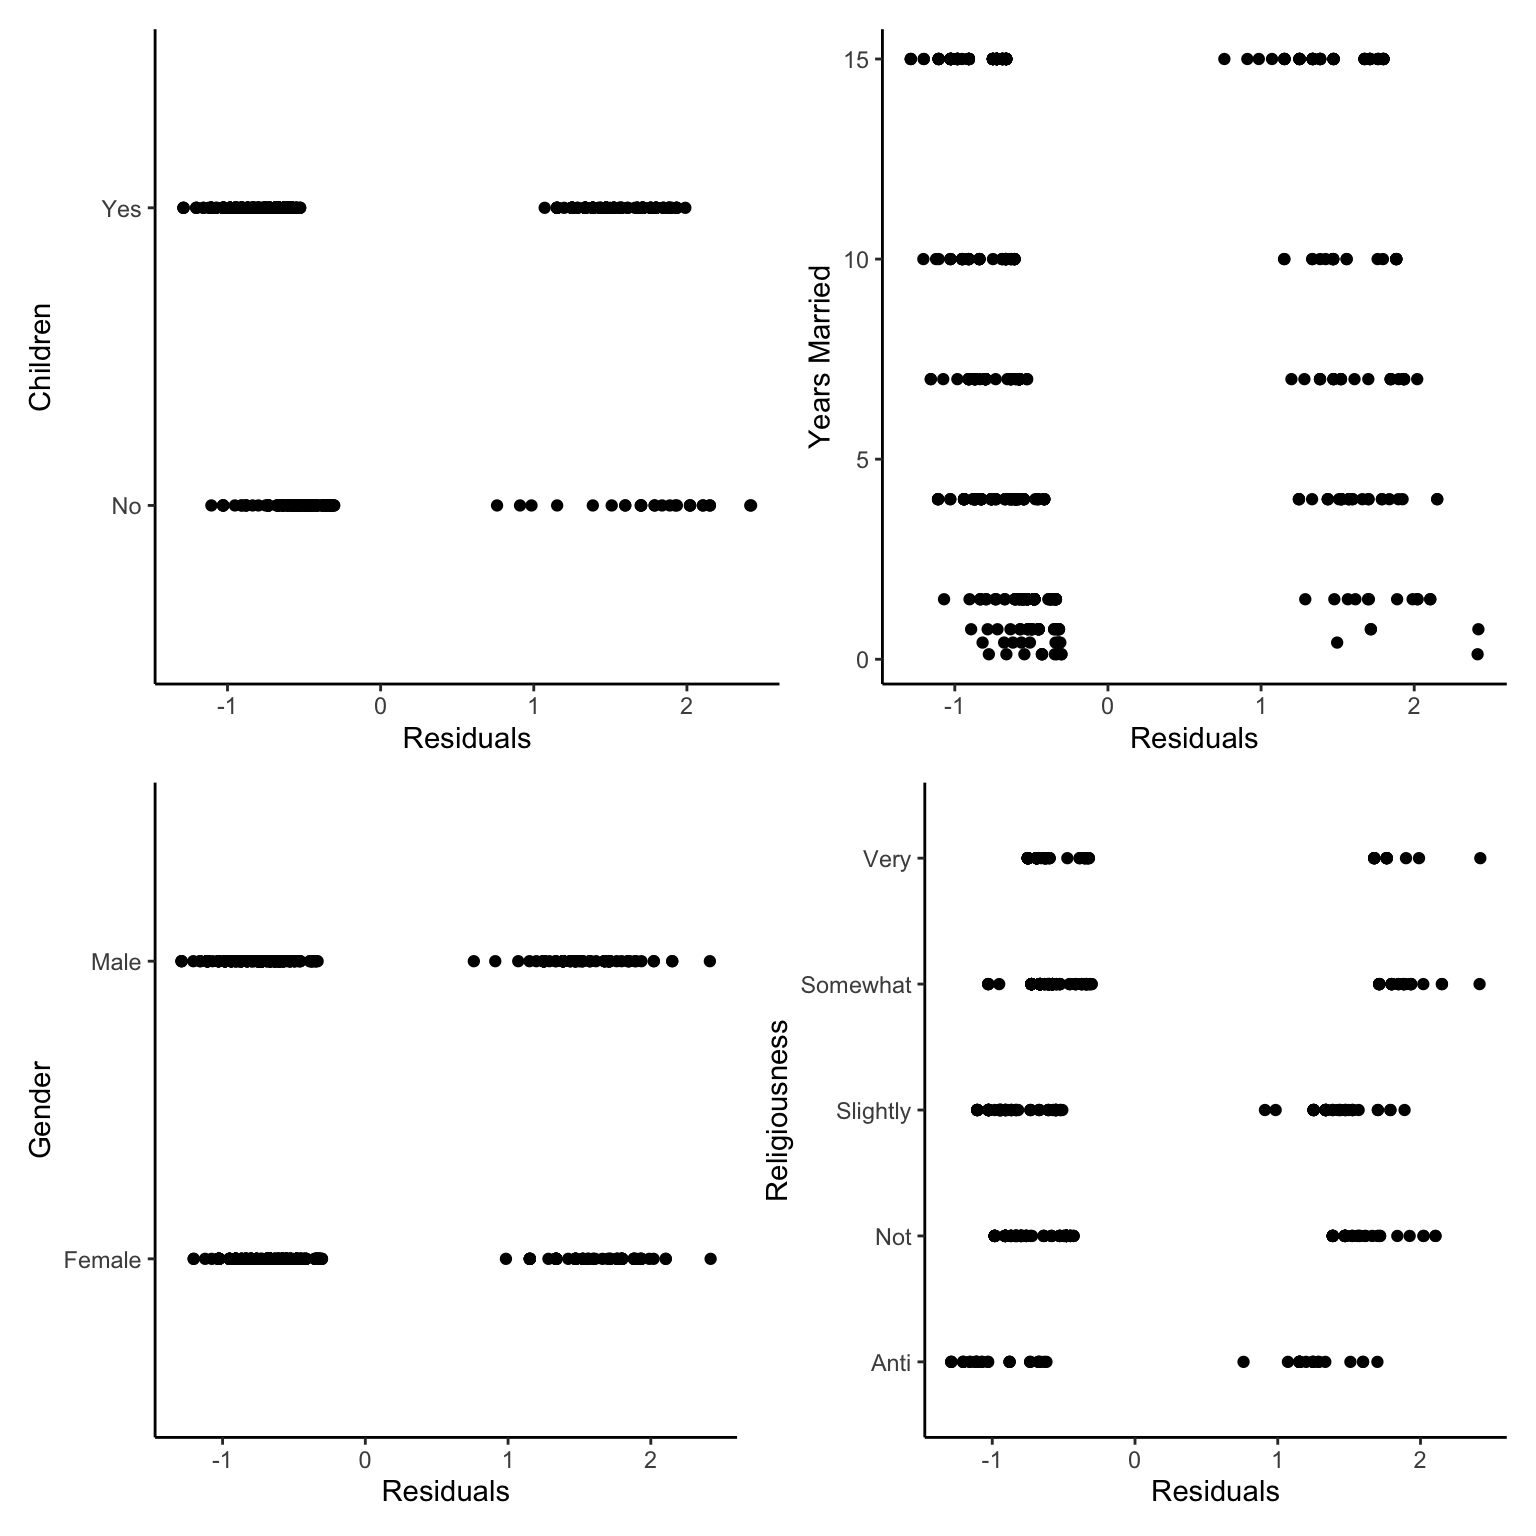
As earlier, we don’t see the plot for homogeneity of residuals but we do see binned residuals, which show two clear peaks of residuals. There seems to be two clear elements/patterns within our data. Generally, we shouldn’t accept this model diagnostic. One trick to find out where these issues come from can be to plot the residuals against the fixed factors in the model.
There seems to be no clear patterns we can see, so we must have some other issue somewhere, we will continue with caution now but that would not be advisable normally.
summary(glm2)
Call:
glm(formula = affairs_bin ~ Children * Yearsmarried + Gender +
    Religiousness_fct, family = "binomial", data = Affairs_binom)

Coefficients:
                          Estimate Std. Error z value Pr(>|z|)
(Intercept)               -1.61951    0.42272  -3.831 0.000128 ***
ChildrenYes                1.10918    0.40614   2.731 0.006314 **
Yearsmarried               0.16780    0.05222   3.213 0.001312 **
GenderMale                 0.19597    0.19837   0.988 0.323212
Religiousness_fctNot      -0.73164    0.35634  -2.053 0.040052 *
Religiousness_fctSlightly -0.42674    0.36140  -1.181 0.237685
Religiousness_fctSomewhat -1.45482    0.36579  -3.977 6.97e-05 ***
Religiousness_fctVery     -1.37705    0.44453  -3.098 0.001950 **
ChildrenYes:Yearsmarried  -0.12986    0.05682  -2.286 0.022282 *
---
Signif. codes:  0 '***' 0.001 '**' 0.01 '*' 0.05 '.' 0.1 ' ' 1

(Dispersion parameter for binomial family taken to be 1)

    Null deviance: 675.38  on 600  degrees of freedom
Residual deviance: 628.38  on 592  degrees of freedom
AIC: 646.38

Number of Fisher Scoring iterations: 4
Here we have, for the first time sing our penguins example, multiple levels in a categorical fixed effect. This highlights a behaviour that \(\beta\) values or Estimate values from GLMs show pairwise effect. So each row in this summary where it says yearsmarried_ft then one of the factor levels, it is comparing that factor level to the base level (<1 Year). Likewise, for religiousness_fct, where Anti is our base value and all factor levels are compared to this base level.
Lets write out the equation for the model, then we can use the values from the summary to create an equation for the model (the predict function will do this for us).
If we wanted to we could write out our model as this (this is a long one as there are so many factors):
\[
\begin{aligned}
y = \beta_{1} Children : Years \:Married \\
+ \beta_{2} Anti \:vs \:Not \:Regligious \\
+ \beta_{3} Anti \:vs \:Somewhat \:Regligious \\
+ \beta_{4} Anti \:vs \:Slightly \:Regligious \\
+ \beta_{5} Anti \:vs \:Very \:Regligious \\
+ \beta_{6} Female \:vs \:Male \:Gender \\
+ \beta_{7} Years \:Married \\
+ \beta_{8} Children \\
+ Intercept
\end{aligned}
\]
This is a lot of \(\beta\) values but thankfully we don’t have to deal with them directly. As before our link function is the logit value.
glm2$family$link
[1] "logit"
When we plot the estimates into this equation, this should be similar to our raw data but not identical. Remember we are creating a model to Generalise the patterns of the raw data, not copy them!
Step Five - Model Interpretation
Thankfully we don’t have to extract each \(\beta\) parameter from the summary table as R has useful functions that can do this for us! To do this we make simulated raw data with the same predictor variables in.
We then use the model to predict() the response variable based on those predictor variables.
Therefore, we make a data set with Children, Years Married, Gender and Religiousness the same as our original data (be careful of spelling and capitalisation, R wants it identical).
The model then predicts the probability of affairs based on those Children, Years Married, Gender and Religiousness factors.
We can also tell the predict function to predict error (Standard Error here that we then convert to an approximation of the 95% confidence interval again we make sure they stay between 0 and 1).
Note that here I tell Predict that I want the fit to be returned on the response scale and not the link scale.
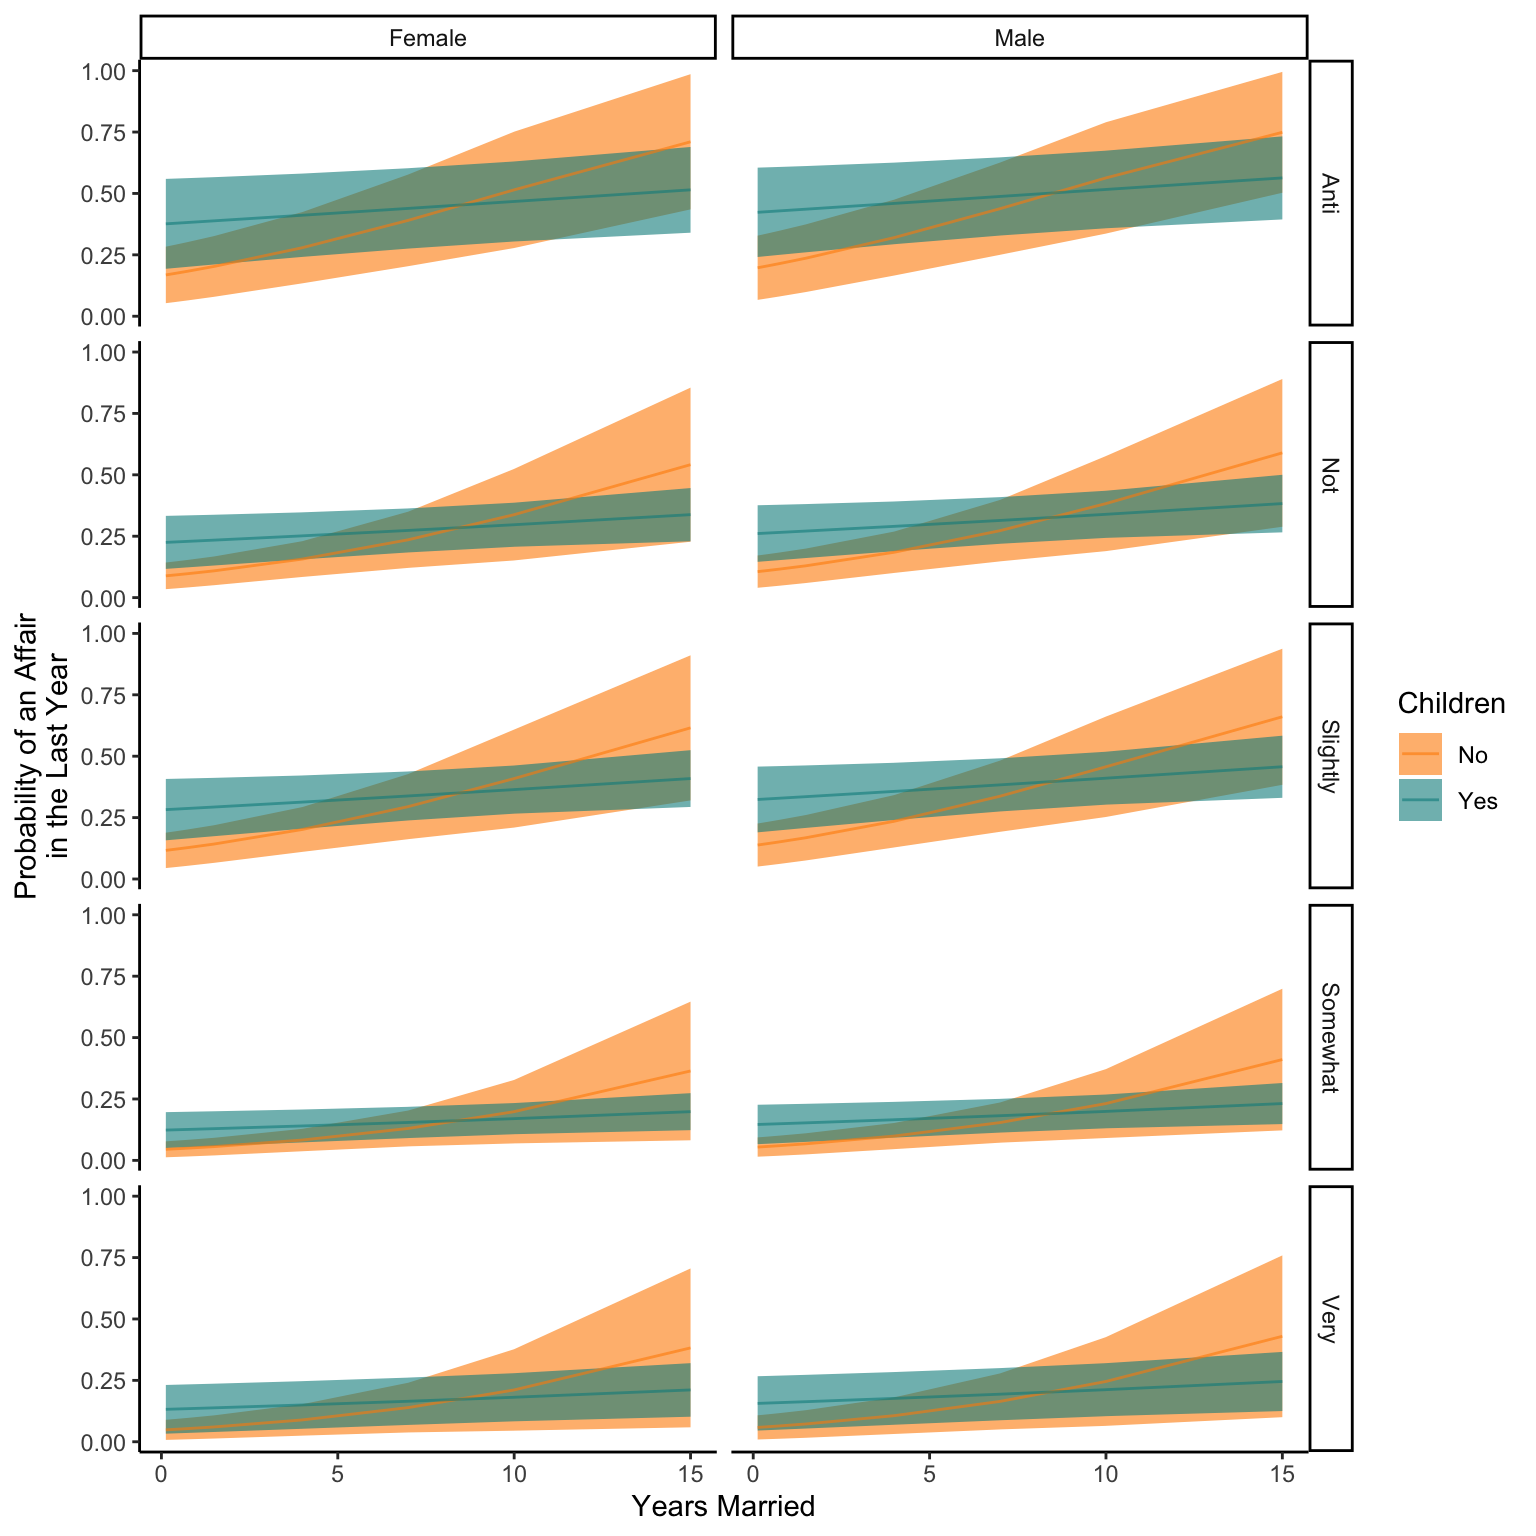
NewData_1<-expand.grid(Children=as.factor(c("Yes","No")),Yearsmarried=unique(Affairs_binom$Yearsmarried),Gender=as.factor(c("Female","Male")),Religiousness_fct=as.factor(c("Anti","Not","Slightly","Somewhat","Very")))Pred<-predict(glm2,NewData_1,se.fit=TRUE,type="response")NewData<-NewData_1 %>%mutate(response=Pred$fit,se.fit=Pred$se.fit,Upr=response+(se.fit*1.96),Lwr=response-(se.fit*1.96),Upr=case_when(Upr>1~1,TRUE~Upr),Lwr=case_when(Lwr<0~0,TRUE~Lwr))ggplot(NewData)+geom_ribbon(aes(x=Yearsmarried,ymax=Upr,ymin=Lwr,fill=Children),alpha=0.6)+geom_line(aes(x=Yearsmarried,y=response,colour=Children),alpha=0.6)+facet_grid(Religiousness_fct~Gender)+scale_colour_manual(values=c("darkorange","darkcyan"),)+scale_fill_manual(values=c("darkorange","darkcyan"))+labs(x="Years Married",y="Probability of an Affair\nin the Last Year",fill="Children",colour="Children")+theme_classic()
We wont plot this model output with the raw values to see how well the model has worked as it will look pretty horrible. This is one of the biggest issues with Binomial models, the raw data are all 0s and 1s so when plotted it is very hard to see any patterns.
We can see from these plots that the probability of having had an affair in the last year increases with how many years you have been married especially if you don’t have children. This pattern is less clear or obvious if someone is more religious and there doesn’t appear to be any difference in these trends between Males or Females.