Beta GLMs

Introduction
R
GLMs
Stats
Beta
Examples of Beta GLMs
Published

October 3, 2023

Using Beta GLMs

Data Loading - Gasoline

Here we will use the Proportion of Gasoline yielded from Crude Oil after distillation and fractionation give the gravity of the crude oil, pressure of the crude oil, the temperature (in F) at which 10 percent of the crude oil had vaporised and temperature (in F) when all crude oil had vaporised. First of all, because it makes me uncomfortable, we will convert the temperatures to \(\circ\)C.

library(tidyverse)
── Attaching core tidyverse packages ──────────────────────── tidyverse 2.0.0 ──
✔ dplyr     1.1.4     ✔ readr     2.1.5
✔ forcats   1.0.0     ✔ stringr   1.5.1
✔ ggplot2   3.4.4     ✔ tibble    3.2.1
✔ lubridate 1.9.3     ✔ tidyr     1.3.1
✔ purrr     1.0.2     
── Conflicts ────────────────────────────────────────── tidyverse_conflicts() ──
✖ dplyr::filter() masks stats::filter()
✖ dplyr::lag()    masks stats::lag()
ℹ Use the conflicted package (<http://conflicted.r-lib.org/>) to force all conflicts to become errors
library(performance)
library(patchwork)

# install.packages("betareg")

library(betareg)

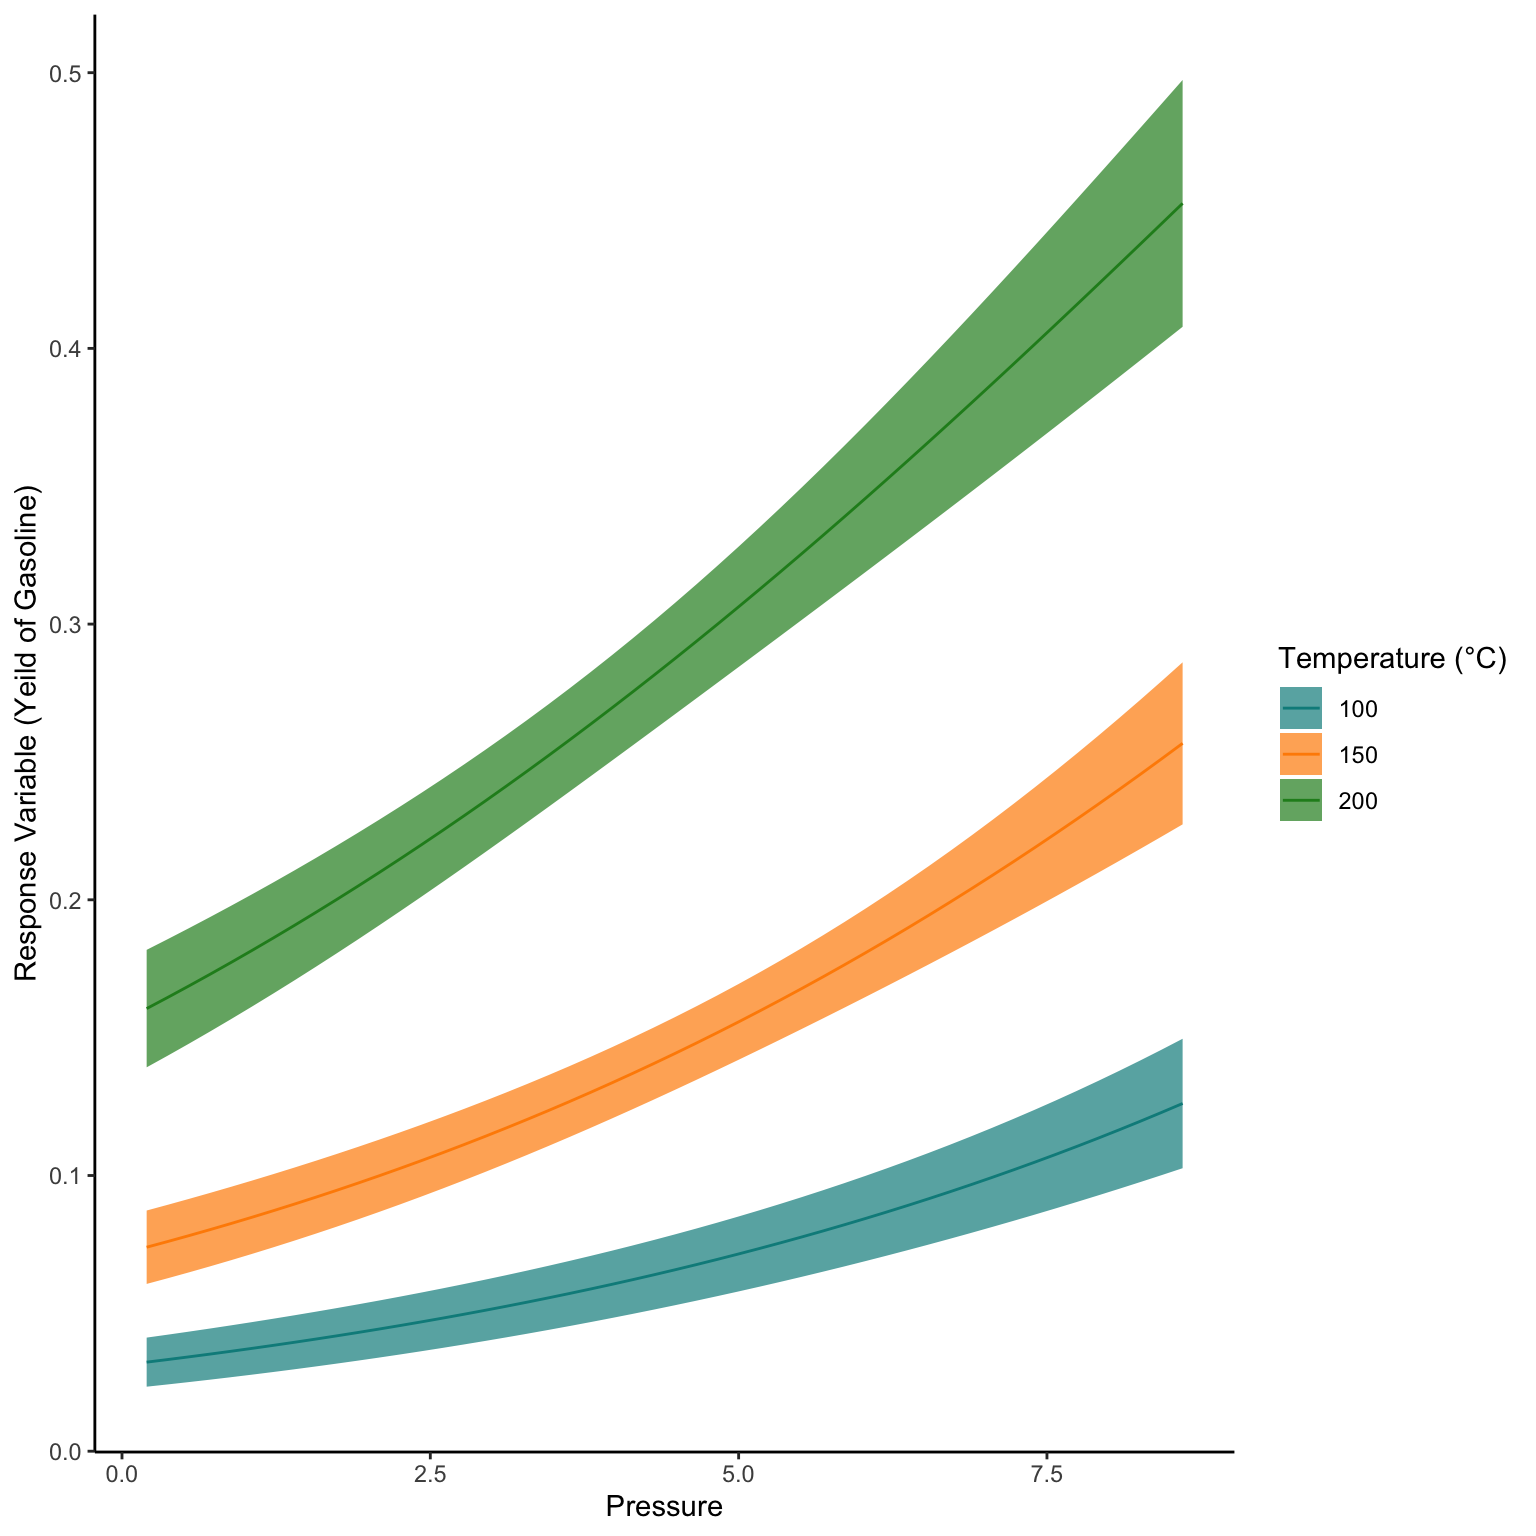
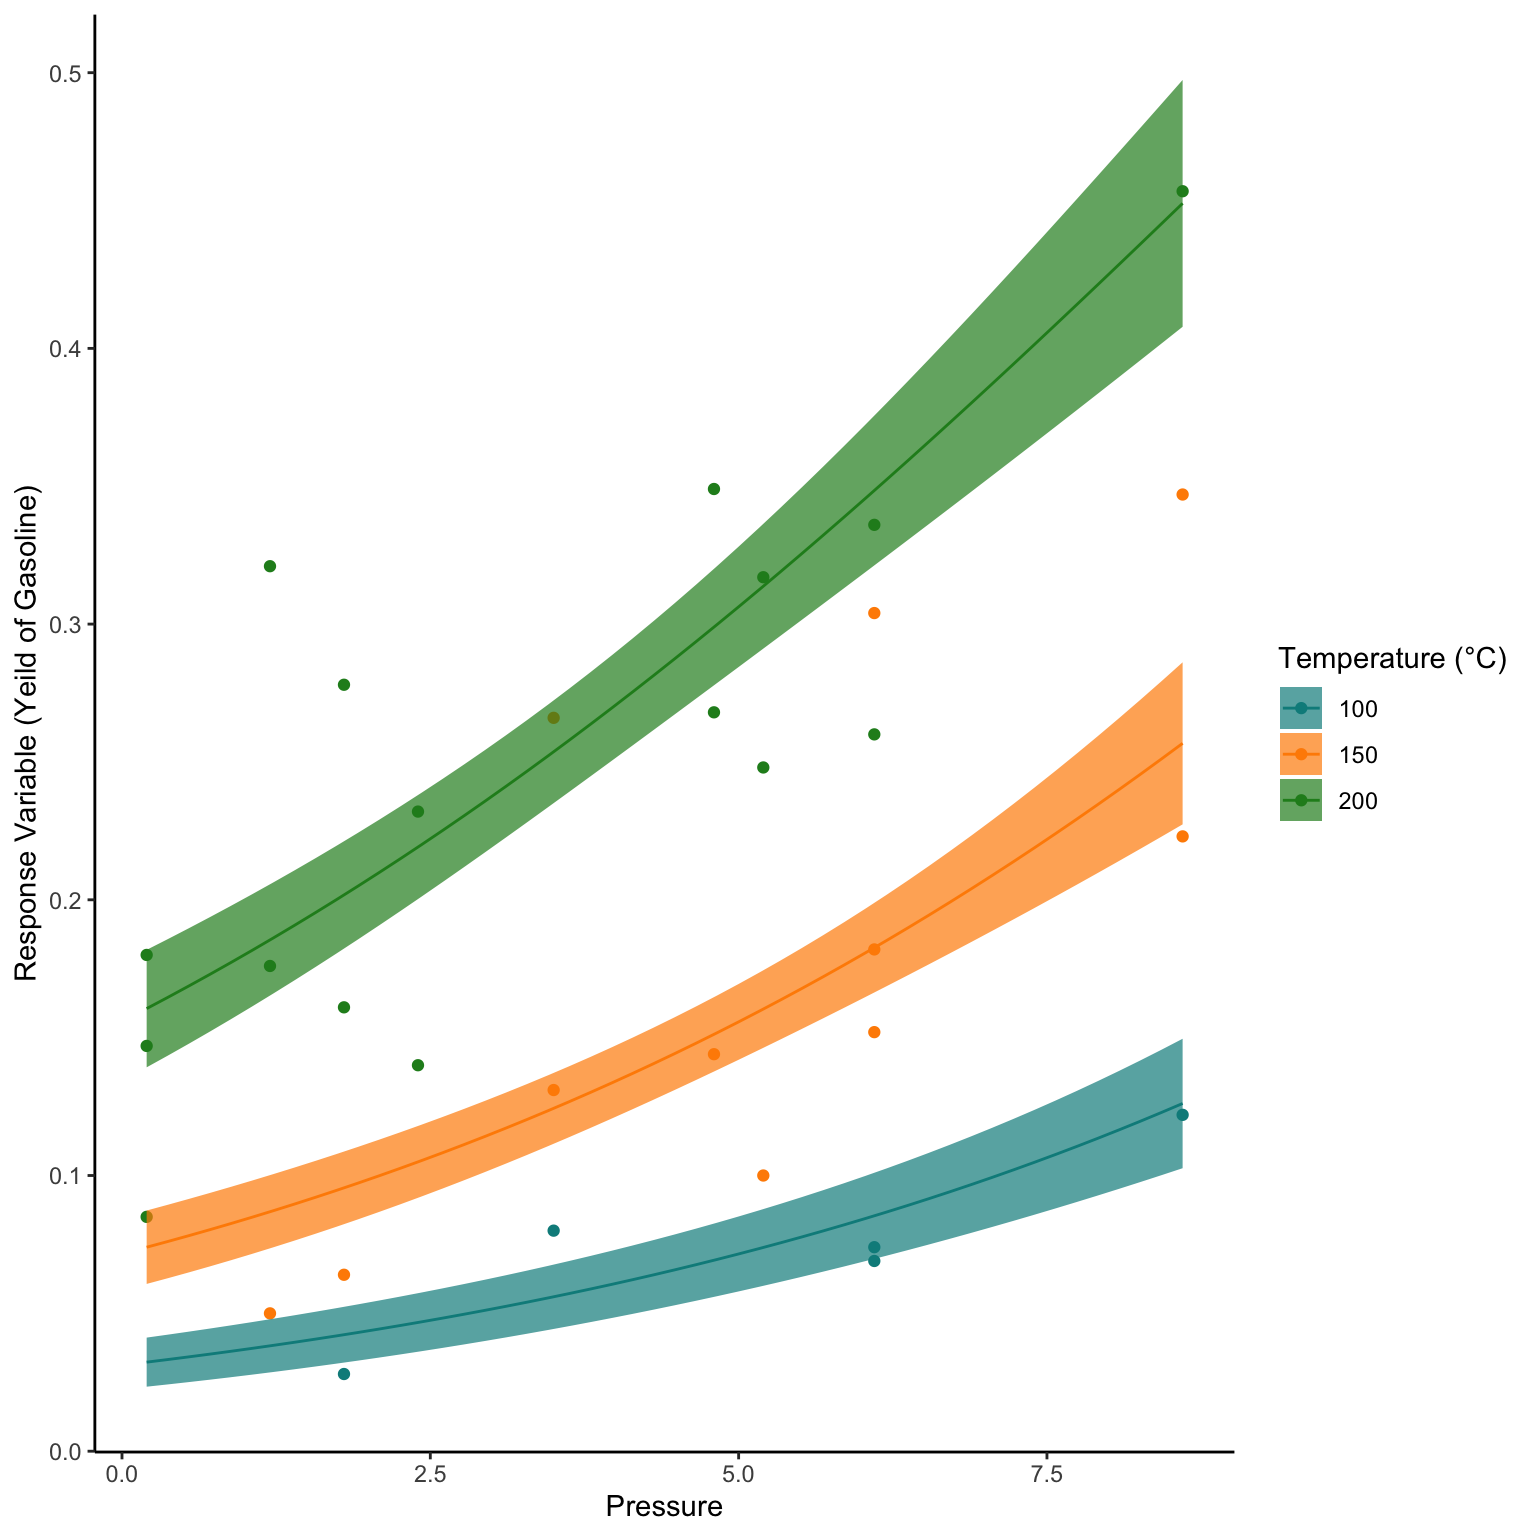
data("GasolineYield", package = "betareg")
 
glimpse(GasolineYield)
Rows: 32
Columns: 6
$ yield    <dbl> 0.122, 0.223, 0.347, 0.457, 0.080, 0.131, 0.266, 0.074, 0.182…
$ gravity  <dbl> 50.8, 50.8, 50.8, 50.8, 40.8, 40.8, 40.8, 40.0, 40.0, 40.0, 3…
$ pressure <dbl> 8.6, 8.6, 8.6, 8.6, 3.5, 3.5, 3.5, 6.1, 6.1, 6.1, 6.1, 6.1, 6…
$ temp10   <dbl> 190, 190, 190, 190, 210, 210, 210, 217, 217, 217, 220, 220, 2…
$ temp     <dbl> 205, 275, 345, 407, 218, 273, 347, 212, 272, 340, 235, 300, 3…
$ batch    <fct> 1, 1, 1, 1, 2, 2, 2, 3, 3, 3, 4, 4, 4, 4, 5, 5, 5, 6, 6, 6, 7…
df<-GasolineYield %>% 
  mutate(temp=(temp-32)*5/9,
         temp10=(temp10-32)*5/9)

Step One - Scienctific Model to Stats Model

Here we will see if the the temperature that the crude oil totally evaporates and the pressure of the crude oil effects the proportional yield of gasoline from that crude oil.

This is a fairly simple model with two fixed effect and can be written as:

Yield of Gasoline ~ Pressure + Temperature

Step Two - Resonse Variable Distribution

As a proportion, Yield of Gasoline can be between 0 and 1, but all real numbers between these upper and lower limits. Therefore it will be a Beta distribution.

Step Three - Organising Fixed Effects

Our data are fairly well distributed across the values

p1<-ggplot(df,aes(x=temp))+
  geom_density(fill="darkcyan",alpha=0.7)+
  theme_classic()+
  labs(x="Temperature (°C)",y="Density")

p2<-ggplot(df,aes(x=pressure))+
  geom_density(fill="darkcyan",alpha=0.7)+
  theme_classic()+
  labs(x="Pressure",y="Density")

p1+p2

As these are looking fine, we shall fit out model with a Beta distribution. The Beta family is not initiated in GLM so we could use the betareg function from the betareg package. However, for predicting standard error and syntax reasons this is very different from all the GLMs we have already carried out. So we will use the gam() function. This is from the mgcv package and used to model non linear General Additive Models using something called splines. We can use it without using splines and it will behave identically to the glm() function. Infact, for all the GLM tutorials we could have swapped the glm() function for gam(). We will cover GAMs later on but GAMs are GLMs that have smooth terms attached to fixed effects.

# install.packages("mgcv")

library(mgcv)
Loading required package: nlme

Attaching package: 'nlme'
The following object is masked from 'package:dplyr':

    collapse
This is mgcv 1.9-0. For overview type 'help("mgcv-package")'.
glm1 <- gam(yield ~ pressure+temp, data = df, family = betar(link="logit"))

Step Four - Assessing Model Functioning

ModelOutputs<-data.frame(Fitted=fitted(glm1),
                  Residuals=resid(glm1))

p3<-ggplot(ModelOutputs)+
    geom_point(aes(x=Fitted,y=Residuals))+
    theme_classic()+
    labs(y="Residuals",x="Fitted Values")

p4<-ggplot(ModelOutputs) +
    stat_qq(aes(sample=Residuals))+
    stat_qq_line(aes(sample=Residuals))+
    theme_classic()+
    labs(y="Sample Quartiles",x="Theoretical Quartiles")


p3+p4

These plots look fairly good, very little patterns in the Fitted vs Residuals and the points generally follow the 1:1 qqnorm plot, with a few points and low and high values not following the line.

summary(glm1)

Family: Beta regression(119.257) 
Link function: logit 

Formula:
yield ~ pressure + temp

Parametric coefficients:
             Estimate Std. Error z value Pr(>|z|)    
(Intercept) -5.180079   0.261752  -19.79   <2e-16 ***
pressure     0.174289   0.016830   10.36   <2e-16 ***
temp         0.017455   0.001261   13.84   <2e-16 ***
---
Signif. codes:  0 '***' 0.001 '**' 0.01 '*' 0.05 '.' 0.1 ' ' 1


R-sq.(adj) =  0.894   Deviance explained = 91.1%
-REML = -54.103  Scale est. = 1         n = 32

Lets write out the equation for the model, then we can use the values from the summary to create an equation for the model (the predict function will do this for us).

If we wanted to we could write out our model as this:

\[Yield\; of\; Gasoline = Beta(y',\phi)\]

\[y'=logit(y)\]

\[ \begin{aligned} y = \beta_{1} Pressure \\ \beta_{2} Temperature \\ + Intercept \end{aligned} \]

As the Beta distribution requires two shape parameters (\(y'\) and \(\phi\)), where \(y'\) must be above zero and below 1, we must convert out linear equation results (\(y\)) so that it is bound between 0 and 1. This means we use the link function, which for Beta models is by default logit. We can use a different link function if we want such as probit or clogit. But generally the default is good.

glm1$family$link
[1] "logit"

When we plot the estimates into this equation, this should be similar to our raw data but not identical. Remember we are creating a model to Generalise the patterns of the raw data, not copy them!

Step Five - Model Interpretation

As always we then use the model to predict() the response variable based on those predictor variables.

Therefore, we make a data set with pressure and temperature the same as our original data (be careful of spelling and capitalisation, R wants it identical).

The model then predicts the average yield of gasoline based on those pressures and temperatures.

We can tell the predict function to get standard errors. Currently, there are no simple methods for estimating the standard error for a betareg object. This is why we used the gam() function. We will only predict three temperature values to make things easier to plot and we can colour by those temperatures.

NewData_1<-expand_grid(pressure=seq(min(df$pressure),max(df$pressure),length.out=50),
                      temp=c(100,150,200)
                      )

Pred<-predict(glm1,NewData_1,se.fit=T,type="response")


NewData<-NewData_1 %>% 
  mutate(response=Pred$fit,
         se.fit=Pred$se.fit,
         Upr=response+(se.fit*1.96),
         Lwr=response-(se.fit*1.96)) 

ggplot(NewData)+
  geom_ribbon(aes(x=pressure,
                    ymax=Upr,
                    ymin=Lwr,
                    fill=as.factor(temp)),
              alpha=0.7)+
  geom_line(aes(x=pressure,
                 y=response,
                  colour=as.factor(temp)))+
  scale_fill_manual(values = c("darkcyan","darkorange","forestgreen"))+
  scale_colour_manual(values = c("darkcyan","darkorange","forestgreen"))+
  labs(x="Pressure",y="Response Variable (Yeild of Gasoline)",
       fill="Temperature (°C)",colour="Temperature (°C)")+
  theme_classic()

Now lets plot this model output over the raw values to see how well the model has worked. To colour by temperature in the original data we will set groups.

df_1<-df %>% 
  mutate(temp=case_when(temp<=125~100,
                              temp>125 & temp<=175~150,
                              temp>175~200))

ggplot(NewData)+
  geom_point(data=df_1,aes(x=pressure,y=yield,colour=as.factor(temp)))+
  geom_ribbon(aes(x=pressure,
                    ymax=Upr,
                    ymin=Lwr,
                    fill=as.factor(temp)),
              alpha=0.7)+
  geom_line(aes(x=pressure,
                 y=response,
                  colour=as.factor(temp)))+
  scale_fill_manual(values = c("darkcyan","darkorange","forestgreen"))+
  scale_colour_manual(values = c("darkcyan","darkorange","forestgreen"))+
  labs(x="Pressure",y="Response Variable (Yeild of Gasoline)",
       fill="Temperature (°C)",colour="Temperature (°C)")+
  theme_classic()

Some Caveats

This looks quite good. However, again it is based off of very little data, only 32 data points, which could be misleading. However it illustrates our point well and shows that from this data, given our assumptions and understanding of the effects, Yield increases with increasing pressure and also increases with increasing temperature.

Data Loading - Dyslexic Reading

This dataset is a number of reading accuracy scores from children with and without dyslexia as well as their non-verbal IQ scores.

data("ReadingSkills", package = "betareg")

Step One - Scienctific Model to Stats Model

We want to assess, from this data, if reading accuracy is increase by an individuals non-verbal IQ and if this effect is influenced by them having been diagnosed as dyslexic or not.

We can write the stats model as:

Accuracy ~ IQ*Dyslexia

Step Two - Resonse Variable Distribution

Here the accuracy score is a value from 0 to 1, as all accuracy scores have to logically be. Therefore, we will use the Beta distribution.

Step Three - Organising Fixed Effects

Lets check all our fixed effects.

p1<-ggplot(ReadingSkills,aes(x=dyslexia))+
  geom_bar(fill="darkcyan",alpha=0.7)+
  theme_classic()+
  labs(x="Dyslexia Diagnosis",y="Count")


p2<-ggplot(ReadingSkills,aes(x=iq))+
  geom_density(fill="darkcyan",alpha=0.7)+
  theme_classic()+
  labs(x="Non-Verbal IQ",y="Density")


(p1+p2)

These both look well spread or evenly spread generally. Although less Dyslexic diagnoses.

glm2<-gam(accuracy ~ iq*dyslexia,data=ReadingSkills, family = betar(link="logit"))

Step Four - Assessing Model Functioning

ModelOutputs<-data.frame(Fitted=fitted(glm2),
                  Residuals=resid(glm2))

p3<-ggplot(ModelOutputs)+
    geom_point(aes(x=Fitted,y=Residuals))+
    theme_classic()+
    labs(y="Residuals",x="Fitted Values")

p4<-ggplot(ModelOutputs) +
    stat_qq(aes(sample=Residuals))+
    stat_qq_line(aes(sample=Residuals))+
    theme_classic()+
    labs(y="Sample Quartiles",x="Theoretical Quartiles")


p3+p4

Here the qqnorm plot is okay, with a bit of under prediction but nothing too wrong. Now these residuals vs fitted values look horrible. However, for homoskedastity in residuals we want a mirror image above and below the 0 line. We are actually getting a pretty good mirror image, our data is just split between two clear groups. This may be an issue that we haven’t come across or we may chose to ignore it. Here we will proceed with caution.

summary(glm2)

Family: Beta regression(10.455) 
Link function: logit 

Formula:
accuracy ~ iq * dyslexia

Parametric coefficients:
            Estimate Std. Error z value Pr(>|z|)    
(Intercept)   1.3205     0.1308  10.098  < 2e-16 ***
iq            0.1582     0.1363   1.160    0.246    
dyslexia     -0.9626     0.1308  -7.361 1.83e-13 ***
iq:dyslexia  -0.2156     0.1363  -1.582    0.114    
---
Signif. codes:  0 '***' 0.001 '**' 0.01 '*' 0.05 '.' 0.1 ' ' 1


R-sq.(adj) =  0.673   Deviance explained =   76%
-REML = -46.461  Scale est. = 1         n = 44

Okay there are a lot of numbers here but what does it actually mean?

Lets write out the equation for the model, then we can use the values from the summary to create an equation for the model (the predict function will do this for us).

If we wanted to we could write out our model as this:

\[Reading \;Accuracy = Beta(y',\phi)\]

\[y'=y^{-1}\]

\[ \begin{aligned} y = \beta_{1} IQ:Dyslexia\\ + \beta_{2} Dyslexia\\ + \beta_{3} IQ\\ + Intercept \end{aligned} \]

As the Beta distribution requires two shape parameters (\(y'\) and \(\phi\)), where \(y'\) must be above zero and below 1, we must convert out linear equation results (\(y\)) so that it is bound between 0 and 1. This means we use the link function, which for Beta models is by default logit. We can use a different link function if we want such as probit or clogit. But generally the default is good.

glm2$family$link
[1] "logit"

When we plot the estimates into this equation, this should be similar to our raw data but not identical. Remember we are creating a model to Generalise the patterns of the raw data, not copy them!

Step Five - Model Interpretation

Thankfully we don’t have to extract each \(\beta\) parameter from the summary table as R has useful functions that can do this for us! To do this we make simulated raw data with the same predictor variables in.

We then use the model to predict() the response variable based on those predictor variables.

Therefore, we make a data set with age and diet the same as our original data (be careful of spelling and capitalisation, R wants it identical).

The model then predicts the average weight based on those ages and diets.

We can also tell the predict function to predict error (Standard Error here that we then convert to an approximation of the 95% confidence interval).

Note that here I tell Predict that I want the fit to be returned on the response scale and not the link scale.

NewData_1<-expand.grid(iq=seq(min(ReadingSkills$iq),max(ReadingSkills$iq),length.out=100),
                       dyslexia=as.factor(c("no","yes")))

Pred<-predict(glm2,NewData_1,se.fit=TRUE,type="response")

NewData<-NewData_1 %>% 
  mutate(response=Pred$fit,
         se.fit=Pred$se.fit,
         Upr=response+(se.fit*1.96),
         Lwr=response-(se.fit*1.96))

ggplot(NewData)+
  geom_ribbon(aes(x=iq,ymax=Upr,ymin=Lwr,fill=dyslexia),
              alpha=0.6)+
  geom_line(aes(x=iq,y=response,colour=dyslexia))+
  labs(x="Non-Verbal IQ",y="Predicted Reading Accuracy",
       fill="Dyslexia\nDiagnosis",colour="Dyslexia\nDiagnosis")+
  scale_fill_manual(values = c("darkcyan","darkorange"))+
  scale_colour_manual(values = c("darkcyan","darkorange"))+
  theme_classic()

Now lets plot this model output with the raw values to see how well the model has worked.

ggplot(NewData)+
  geom_point(data=ReadingSkills,aes(x=iq,y=accuracy,colour=dyslexia))+
  geom_ribbon(aes(x=iq,ymax=Upr,ymin=Lwr,fill=dyslexia),
              alpha=0.6)+
  geom_line(aes(x=iq,y=response,colour=dyslexia))+
  labs(x="Non-Verbal IQ",y="Predicted Reading Accuracy",
       fill="Dyslexia\nDiagnosis",colour="Dyslexia\nDiagnosis")+
  scale_fill_manual(values = c("darkcyan","darkorange"))+
  scale_colour_manual(values = c("darkcyan","darkorange"))+
  theme_classic()

Some Caveats

Here we have some clear differences in reading accuracy seen between dyslexic diagnosis no and yes, but from this model we wouldn’t say this effect changes with non-verbal iq. However, as a topic to analyse Dyslexia is a far more complex subject than these 44 observations.