So far we have used models to describe data but a lot of times we might want to create a model that is able to predict new data. This may be new data outside of our temporal or spatial range, or outside of our current knowledge base. The best set of tools for predicting new data is generally Machine Learning (ML) methods. For a pretty full and comprehensive discussion, with advantages and disadvantages go here: https://ml-science-book.com/
Unsupervised ML
One group of ML models, requiring minimum input, are Unsupervised models do not required training/labelled data and thus require less initial work. These methods will group similar data into groups or clusters. As the vast majority of data is unlabelled Unsupervised models appeal in that they can be applied with no prior work. However, the user will normally define how many groups to split the data into or at what level of similarity to split, and thus may influence the model itself. Generally, these methods are poor at complex prediction tasks and can be easily outperformed by Supervised ML.
Supervised ML
Supervised learning algorithms or models are models where we ‘train’ a model with known and labelled data so that the model can discern patterns that when it is given unknown/unlabelled data it will be able to, hopefully, predict what the label should be. These models can perform both regression (continuous data) or classification (categorical data), but will be highly reliant on the data used to train the model, as values or classes outside of what it has already seen will have much higher inaccuracy. There are a few different types of Supervised ML with varying levels of complexity from General Linear Models (GLMs), K-Nearest Neighbours (KNN), Random Forests (RF), Support Vector Machines (SVMs), eXtreme Gradient Boosting (XGBoost) and Neural Networks (NN).
General Workflow for Supervised ML
Regardless of the algorithm to be used the general steps to create a ML model is the same:
1). You have a dataset with a labelled response variable (quantitative or qualitative) and one or more predictor variables (can be quantitative or qualitative or a combination, also called features).
2). These data are split into training data*, testing data. Depending on the amounts of data you have the ratios will vary but often 75/25.
3). The training data are used to train a ML algorithm*.
4). The ML is applied to the testing data to predict what their label should be.
5). The predicted label is compared to the true label of the testing data, and the accuracy of the model is calculated from the difference/similarity between the predicted and true labels.
*For higher accuracy and better model performance, the training data are often split again into folds (often cross validation folds) to repetitively repeat model training with different values elements termed hyper parameters (These are different tuning elements for each different type of model). The different hyper parameter values are used and accuracy is assess on each fold, then the ‘best’ performing hyper parameter values are selected for the model that is then used to predict on the testing data.
Which model type to chose? and why is the data more important?
The most popular ML models are Random Forests (RFs), which require very little hyper parameter training and usually provide good accuracy “off the shelf”. XGBoost models perform to higher accuracy once their hyper parameters are effectively trained but are not as good as RF off the shelf, similarly Neural Networks are generally the most accurate and powerful models available but require far more hyper parameter and model architecture to perfect. With all the different ML models the quantity and quality of training data will dictate the eventually ability of the models. For example, none of these models are able to predict a new class when predicting a classification problem, likewise many of these models (but not all) will be unable or very poor at extrapolating outside of the range of the label training values.
Theory
We won’t go into depth of what each of these models is doing inside these functions as there are very many useful and clear tutorials on the theory behind each different machine learning algorithm. Here we will focus on their application, common mistakes, tricks and challenges. For further reading I would recommend: Julia Silge for tidymodels tutorials (Where I learnt): https://juliasilge.com/, for more complicated theory of random forest (although with python code examples): https://www.analyticsvidhya.com/blog/2021/06/understanding-random-forest/ and for indepth explanation of neural networks I would recommend Jeremy Howards Youtuube channel: https://www.youtube.com/@howardjeremyp (again this is mostly from a python coding approach).
Random Forest with Tidymodels
Here we will go through a simple worked example of a Random Forest in R. There are many packages for applying machine learning algorithms but to continue on the ‘tidy’ theme we will utilise the ‘tidymodels’ ecosystem of packages to apply ML models. Tidymodels brings together many different modelling engines, packages and frameworks, and has a consistent coding style across all of them so that we can swap model type, package or style with minimal effort.
ML Modelling steps:
Pre-process: tidying, splitting and transforming data
Train: Training the model (with or without hyperparameter training)
Validate: Testing the model on the testing data and calculating accuracy
Let’s Give it a Go
We will actually only need the tidymodels package as it lots all the tidyverse in the background too! But lets bring in our old favourite penguin dataset too!
We will be tuning hyper parameters later so we will also split the training data further into 5 cross validation folds. When we look at the fold object we can see that there are 10 sets of the same training data where the split is randomly different each time. As this element has randomisation involved we set a seed to make sure we get consistent results each time the code is run. We also want to make sure that the different levels of the response variable is present in both sides of each fold so we set strata to be species.
With tidymodels we use recipes to integrate transformations and model formula
For our categorical predictors we will convert them to dummy variables. We will also “prep” and “juice” datasets, which creates a dataset where the recipe hase been applied to it for later on.
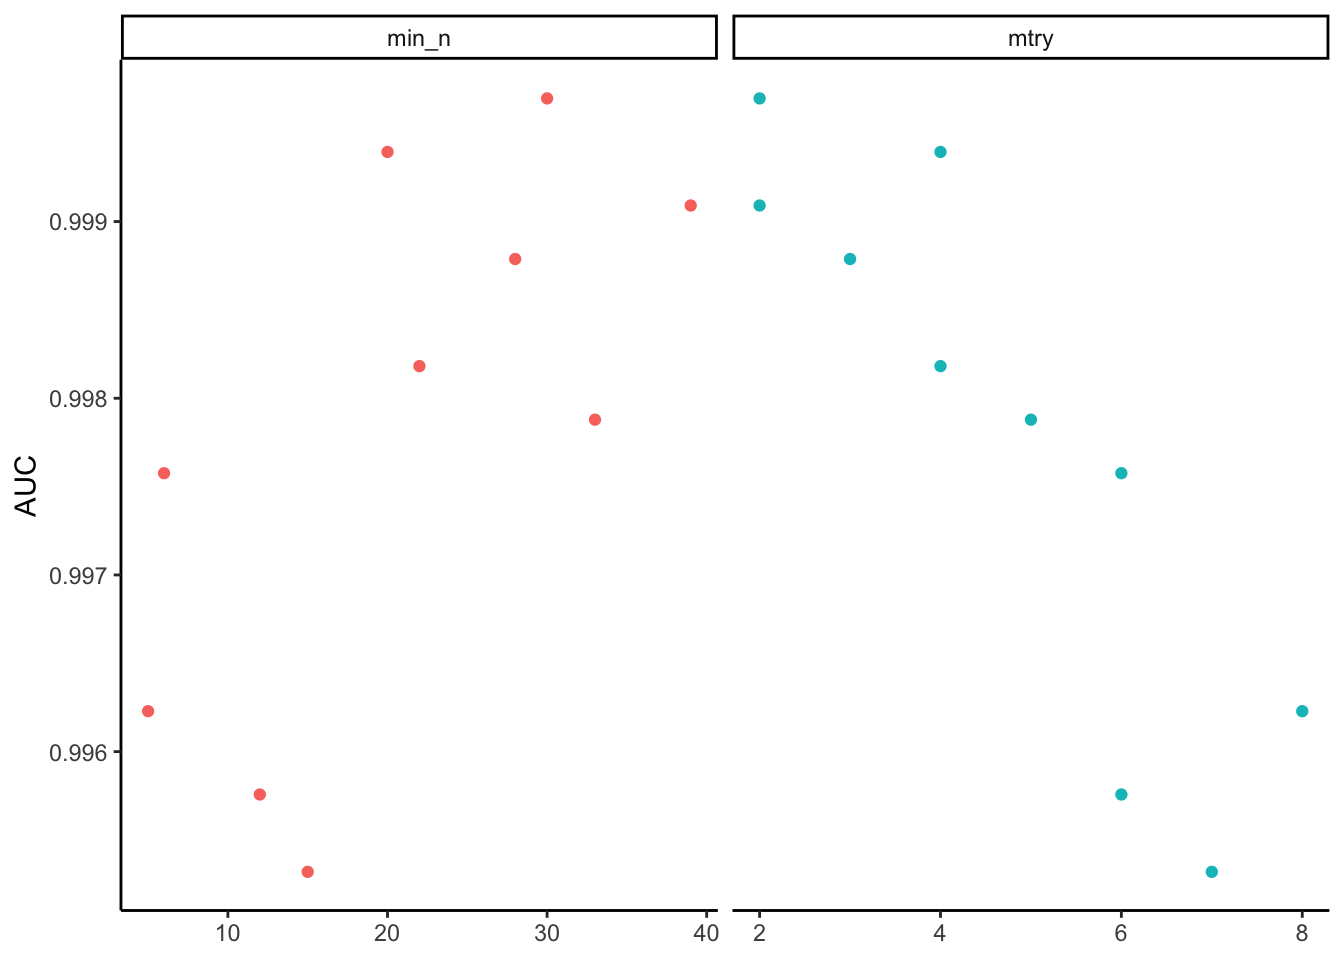
We now create a model object, we can add specific values to the three hyper parameters, or we can tell the model we will try to tune them across our data folds. Here we create the random forest model and tell tidy models it is a classification mode model and we want to use the ranger “engine”.
We can see that the best values are low min_n and low mtry. But we can use a function to select the best hyper parameters from this AUC value, then that is our final model.
So we can see from this that almost all the predictions are the same as the truth. If you want to see how much the random number generation from before effects the results you can rerun this script with different set.seed() numbers.