An Introduction look at loops/ifelse/apply/mapping.
Published
June 5, 2024
Repeating Tasks
Often in R (or other programming languages) we want to repeat a task many times. There are a few options we might use to carry out the same task multiple times: copy and paste the code with minor changes, write a loop that repeats the task for us, map (not the GIS sense but is programming language to alter one thing by another) a function across a list or write a whole function to carry out our task them map that function across our list. Generally, we will copy and paste code when it is only a couple times we repeat the task, map a function over a list when the function to be applied is simple, loop when it is a complex task we want to repeat many times and write a bespoke function when it is a complex process we will carry out many times and we will carry out this process often in time generally.
Loops
So we want to carry out a task multiple times with a slight difference and we don’t want to copy and paste the code lots of times. For example reading in many csv files but there is a different one for each day of a month or we have a 10 locations and want to create and save a map (GIS sense) for each but all in the same style. To achieve this we can use loops. Many of the examples for loops could also be achieved with the apply functions or map functions but each repeats some task with a rule of systematically changing some element of the task each time. Depending on the task or personal preference will dictate which to use. We will first talk about For loops.
We set up a for loop by saying:
for (variable in sequence){expression}.
This is potentially easier to understand in code. We will tell r that for every number from 1 to 7 we want it to calculate and print the square of this value.
The curly brackets aren’t needed when the expression is on the same line, but for easier reading we will normally use curly brackets and have on multiple lines.
for (i in1:7){ x<-i*iprint(paste0(i, " Squared is equal to ", x))}
[1] "1 Squared is equal to 1"
[1] "2 Squared is equal to 4"
[1] "3 Squared is equal to 9"
[1] "4 Squared is equal to 16"
[1] "5 Squared is equal to 25"
[1] "6 Squared is equal to 36"
[1] "7 Squared is equal to 49"
So we can see that the code on its own is first creating some object called x that stores the square of i and then we print a statement saying “i squared is equal to x”. For each loop we replace i with the values 1 to 7 in ascending order. We could change this to be random values that we might want. i is often the first replacement used but it could be anything (letter or phrase).
for (ThisNumber inc(10,2,33,8,152)){ SquareNumber<-ThisNumber*ThisNumberprint(paste0(SquareNumber ," is ",ThisNumber, " squared"))}
[1] "100 is 10 squared"
[1] "4 is 2 squared"
[1] "1089 is 33 squared"
[1] "64 is 8 squared"
[1] "23104 is 152 squared"
If / Else
Within our for loop me might want to have some logical statement that means we apply a different process depending on the sequence value. For example, we might want to print the square of all numbers up to 10 and then print just the raw value after that. To do this we can create an if else statement. Where we have an if statement, which when it is true we do one then, else we do something else.
for (j in1:20){if (j<11){print(paste0(j*j ," is ",j, " squared")) }else {print(paste0(j ," is not squared")) }}
[1] "1 is 1 squared"
[1] "4 is 2 squared"
[1] "9 is 3 squared"
[1] "16 is 4 squared"
[1] "25 is 5 squared"
[1] "36 is 6 squared"
[1] "49 is 7 squared"
[1] "64 is 8 squared"
[1] "81 is 9 squared"
[1] "100 is 10 squared"
[1] "11 is not squared"
[1] "12 is not squared"
[1] "13 is not squared"
[1] "14 is not squared"
[1] "15 is not squared"
[1] "16 is not squared"
[1] "17 is not squared"
[1] "18 is not squared"
[1] "19 is not squared"
[1] "20 is not squared"
Saving Objects from Loops
For some more complex analyses we might want to save a df for each loop that we carry out. One easy way to do this is save each df as an element of a list object. To do this we create an empty list object. Lets create a random data column with some other groupings. Lets create random data that has a mean the same as the iteration of the for loop and then we can try find the mean of a specific iteration to see that it has a close mean to the iteration value.
library(tidyverse)
── Attaching core tidyverse packages ──────────────────────── tidyverse 2.0.0 ──
✔ dplyr     1.1.4     ✔ stringr   1.5.1
✔ forcats   1.0.0     ✔ tibble    3.2.1
✔ lubridate 1.9.3     ✔ tidyr     1.3.1
── Conflicts ────────────────────────────────────────── tidyverse_conflicts() ──
✖ dplyr::filter() masks stats::filter()
✖ dplyr::lag()    masks stats::lag()
ℹ Use the conflicted package (<http://conflicted.r-lib.org/>) to force all conflicts to become errors
List_to_fill<-list()for (i in1:100){ df<-data.frame(response =rnorm(300,mean=i,sd=4),group1 =c("a","b","c"),group2 =c("d","e","f") ) List_to_fill[[i]]<-df}df_25<-List_to_fill[[25]]mean(df_25$response)
[1] 24.90474
Looping Over Elements of a List
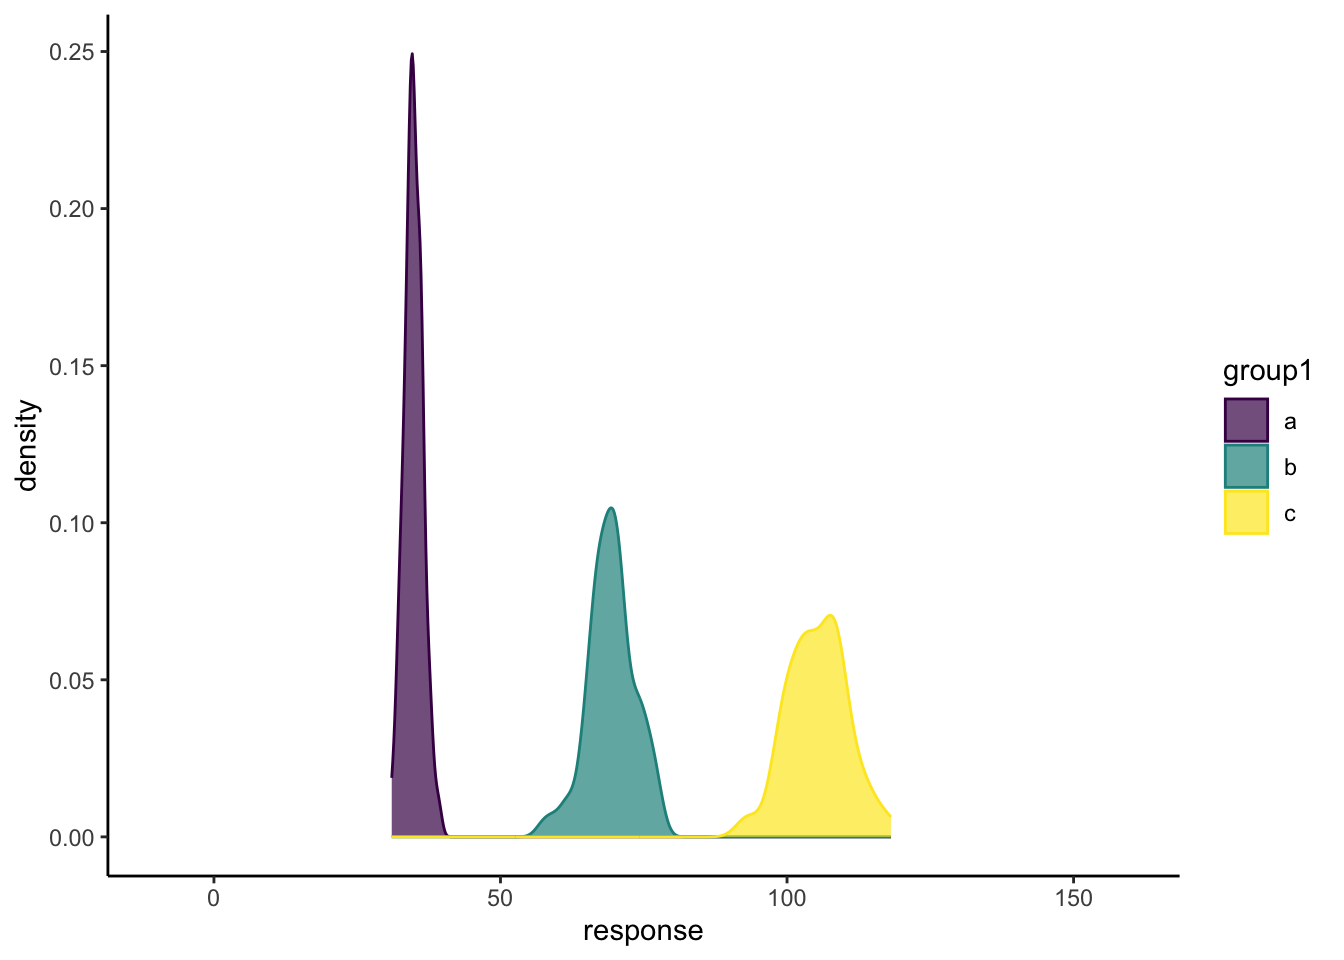
So we might, because we just created it, a list of elements that we want to apply a loop over. So lets print all mean values that are tens (10, 20, 30, etc) and plot the data of the 50th iteration. We know there are 100 dfs in our list but we don’t need to to set the for loop going. We will use the %in% sign to say “is one of” then create a vector of all possible tens between 10 and the length of our list. For some other examples later on we will also save every 10 dataframe as a csv.
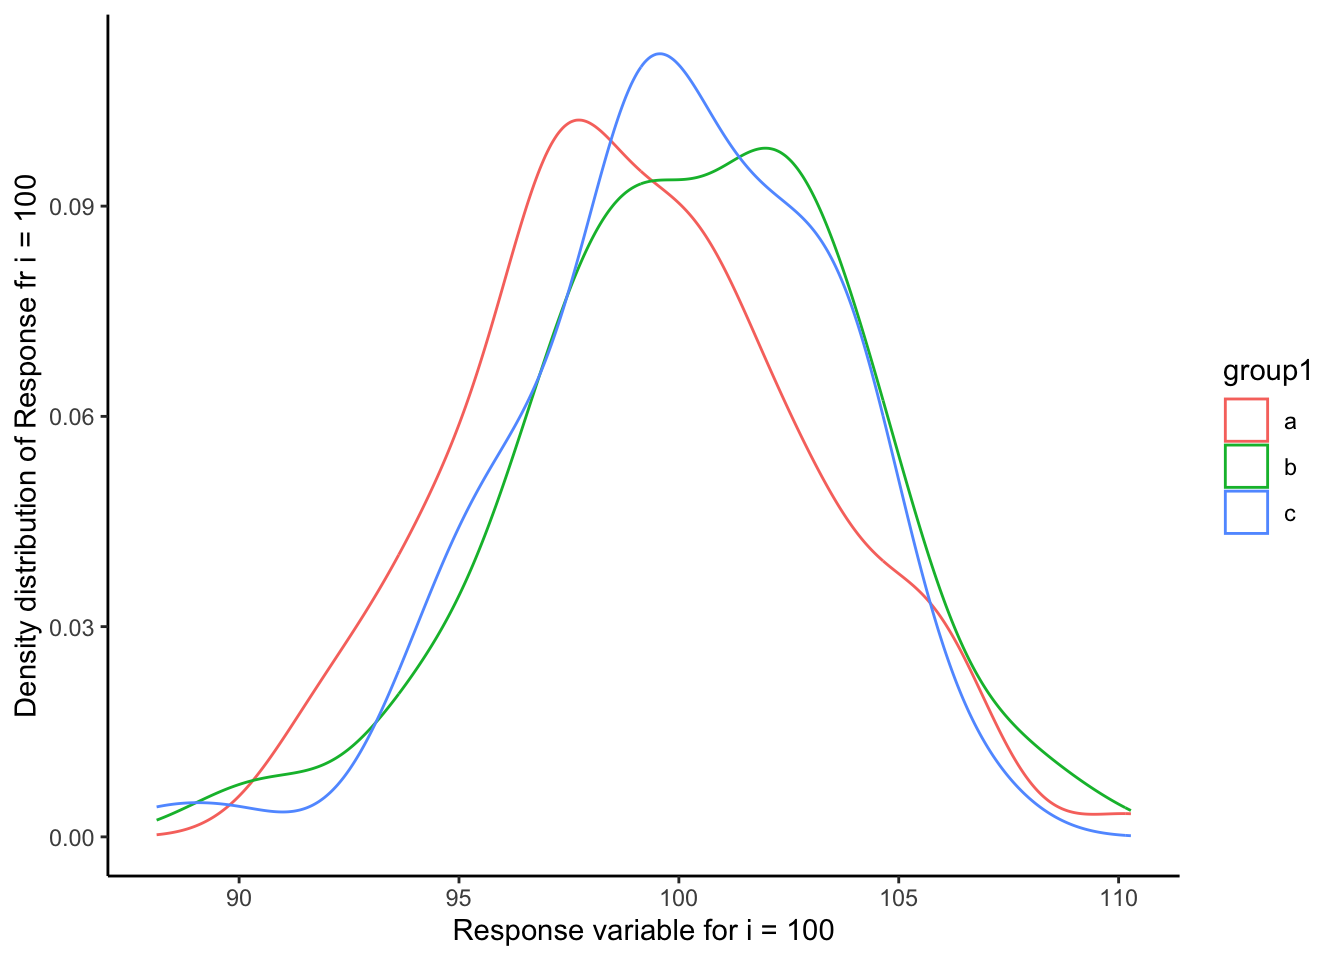
You will notice we use an if without and else. R will just carry out the true statements and do nothing for the else statements. To plot a graph from within a for loop we have to explicitly use the print() function. We want our computer to know that Datafrme_100 is our last df and not our second one so we will add leading zeros to make sure the ordering works.
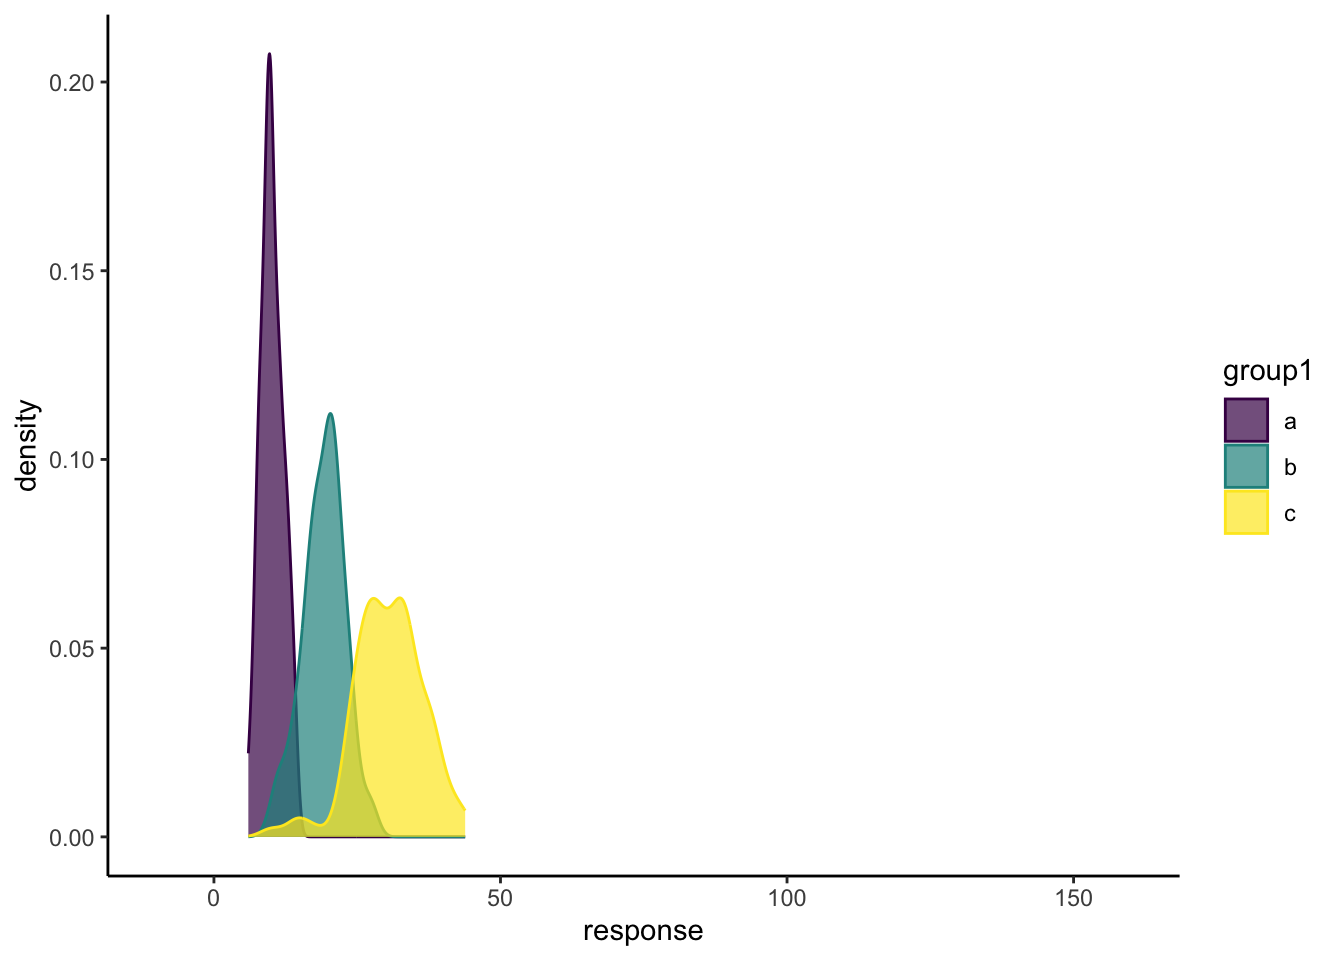
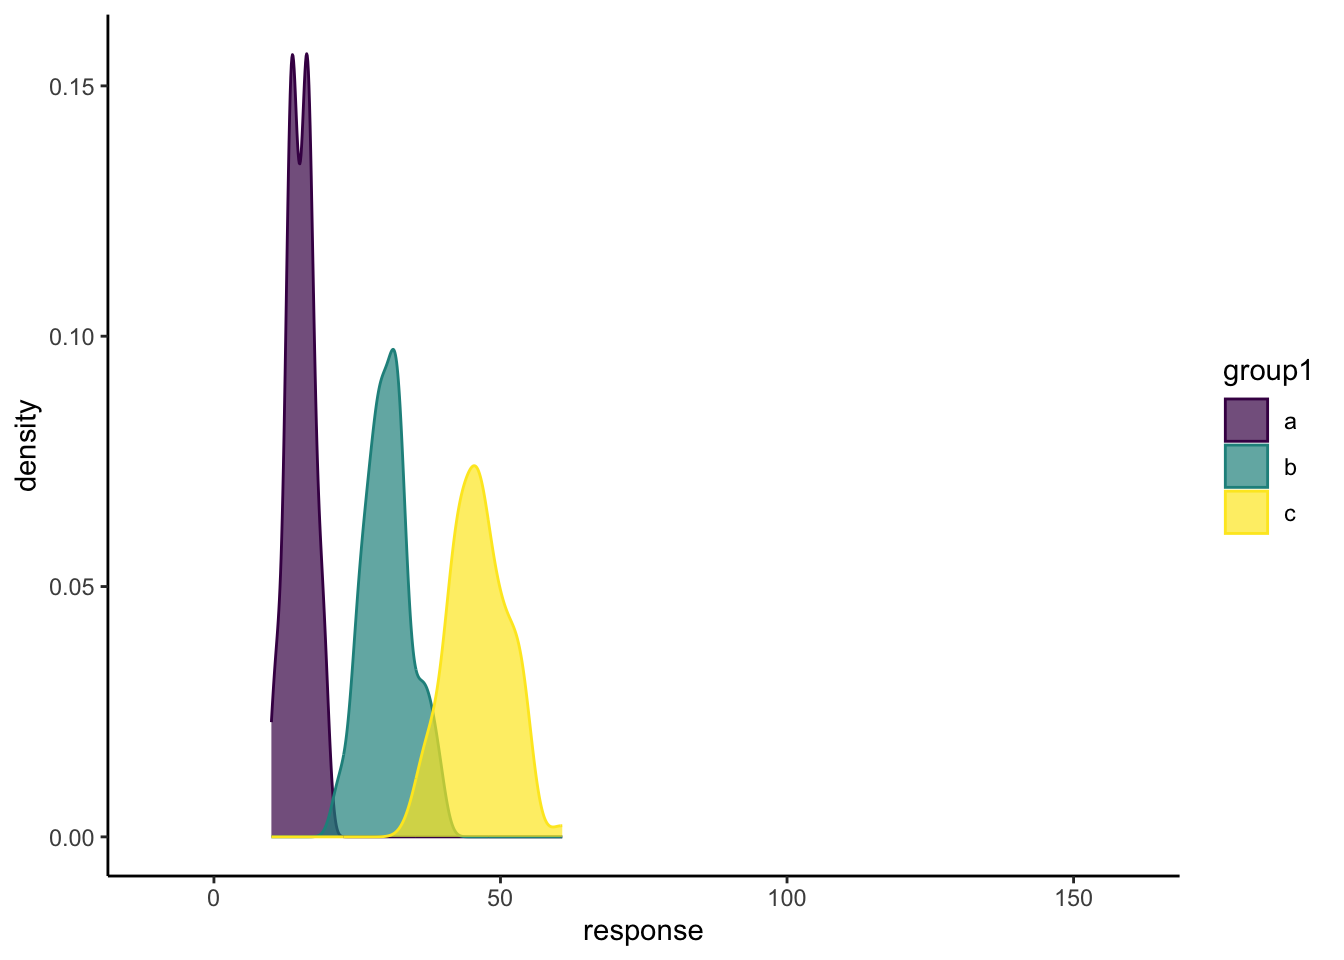
NewList<-list()for ( i in1:length(List_to_fill)){if( i %in% TenSequence){ Mean_Response<-mean(List_to_fill[[i]]$response)print(Mean_Response)write_csv(List_to_fill[[i]],paste0("loop_data/Dataframe_",str_pad(i,3,pad="0"),".csv")) }if( i ==length(List_to_fill)){ df_100<-List_to_fill[[i]]print(ggplot(df_100)+geom_density(aes(x=response,colour=group1))+theme_classic()+labs(x=paste0("Response variable for i = ", i),y=paste0("Density distribution of Response fr i = ", i)) ) } NewList[[i]]<-List_to_fill[[i]]$response}
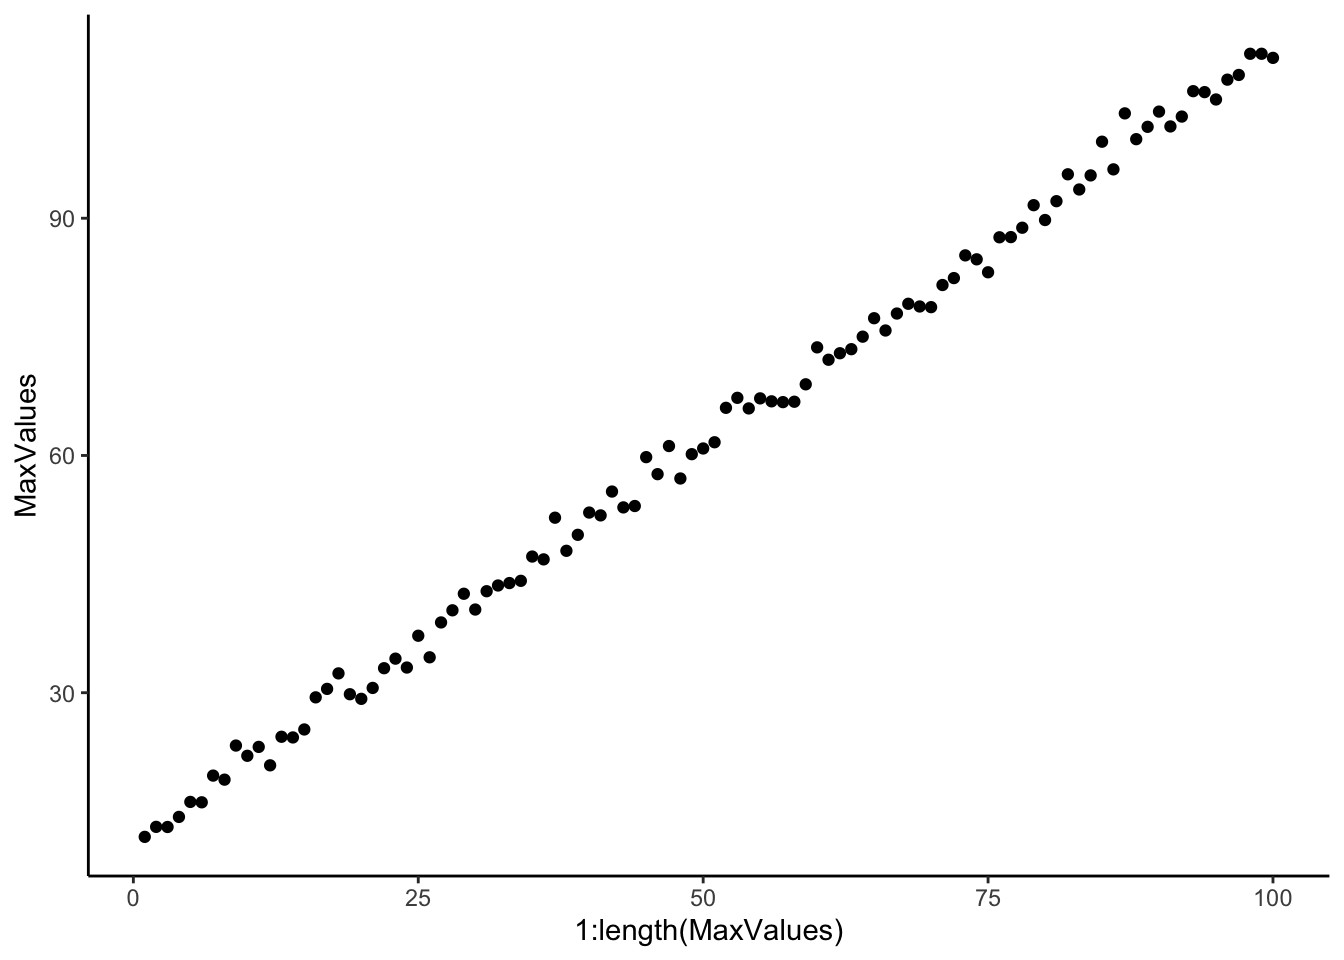
So we can create a new list where we have applied (mapped) a function to every element of the list object we have. This is very similar to for looping, but imaging if we create a list of directory locations for all csv files we want to read into r, we can then apply read_csv() across this list of directories and read in all dfs into a new list object. Lets find out the max value in each of our random distributions, remember the means increased and the standard error stayed consistent. Then lets read back all the csv files we save earlier. The first element in map is the list of directories of files, the second is the function to apply to this list, then we can add arguments to this function as a third argument, for example the way to stop printing column information with read_csv by putting col_types=cols().
# A tibble: 6 × 3
  response group1 group2
     <dbl> <chr>  <chr>
1     7.27 a      d
2     9.02 b      e
3    11.5  c      f
4     7.51 a      d
5    13.2  b      e
6    13.0  c      f
So we now have a list of dataframes, maybe we would want to combine them but keep the information of which iteration they originally came from. To do this we can apply mutate to add a new column and then add them together with bind_rows(). Being part of the tidyverse we can start to use pipes to lay out our code more nicely. As we want to include information about how far along the list we are we will use imap before using map_df to bind the dfs together and return a df.
So we can apply already made functions to lists/vectors using map but maybe what we want to do is more complex than a couple functions but we will be doing this really often so we dont want to write a for loop every time we want to do it. This is where we can create out our function that we will save in our global environment and use when we want.
The layout of function writing is creating a name, this should not be the same as other functions from packages we will use, define what inputs the function will take (arguments) then code to show how the inputs will be processed.
FunctionName <- function(argument1,argument2,…){The process we want our function to do}
At its simplest it could be taking a vector and providing the mean. For Example:
NewMean<-function(vector){ sum_of_vector<-sum(vector) N_vector<-length(vector) Average <- sum_of_vector/N_vectorreturn(Average)}Vector_of_Numbers<-c(2,3,6,4,2,2,4,455,6,777,8,8,9,5)NewMean(Vector_of_Numbers)
[1] 92.21429
So now we have our bespoke function we can map it over a list of vectors to give a mean value for each vector in the list!
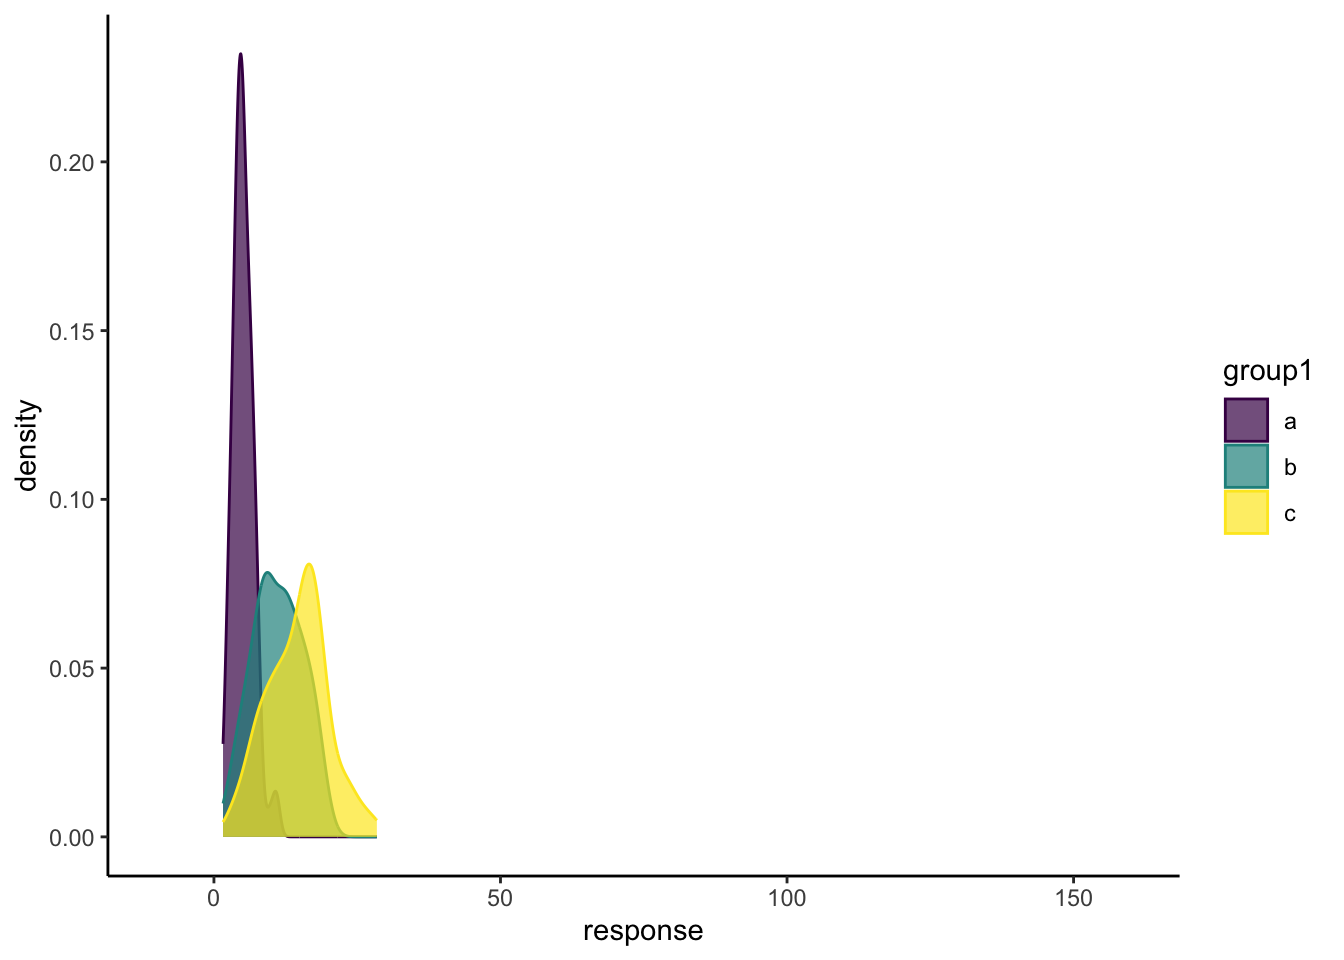
This is quite simplistic but it could be quite a complex function, for example some way of plotting distributions. As column selection in ggplot2 is not using characters like other packages, a double curly brackets syntax is used to show that it is the name of a column inside the data and not another dataframe.