Year <- seq(from=1950,to=2023,by=1)
Treatment <- c("Control","Treatment 1","Treatment 2")
Rep<- seq(from=1,to=10,by=1)

df<-expand.grid(Year=Year,Treatment=Treatment,Rep=Rep)

Response<-rnorm(n=nrow(df),mean = 15,sd=8)

df$Response<-ResponseData Visualisation in R
Introduction
Tidyverse
ggplot2
R
An Introduction to Data Visualisation in R for Research Scientists: From Base Scatter Plots to Facetting GGPlots.
Visualisation 
Lets make some data as we did in the introduction
Base
We can check the data we have using a base plot function
The base plot() function will create a grid that is each column of the data set plotted against all the others, this is fine for continuous data (Such as bill_depth_mm)
but it is hard to understand or read fully.
plot(df)
We can define x and y axes from columns of the data set
plot(x=df$Year,y=df$Response)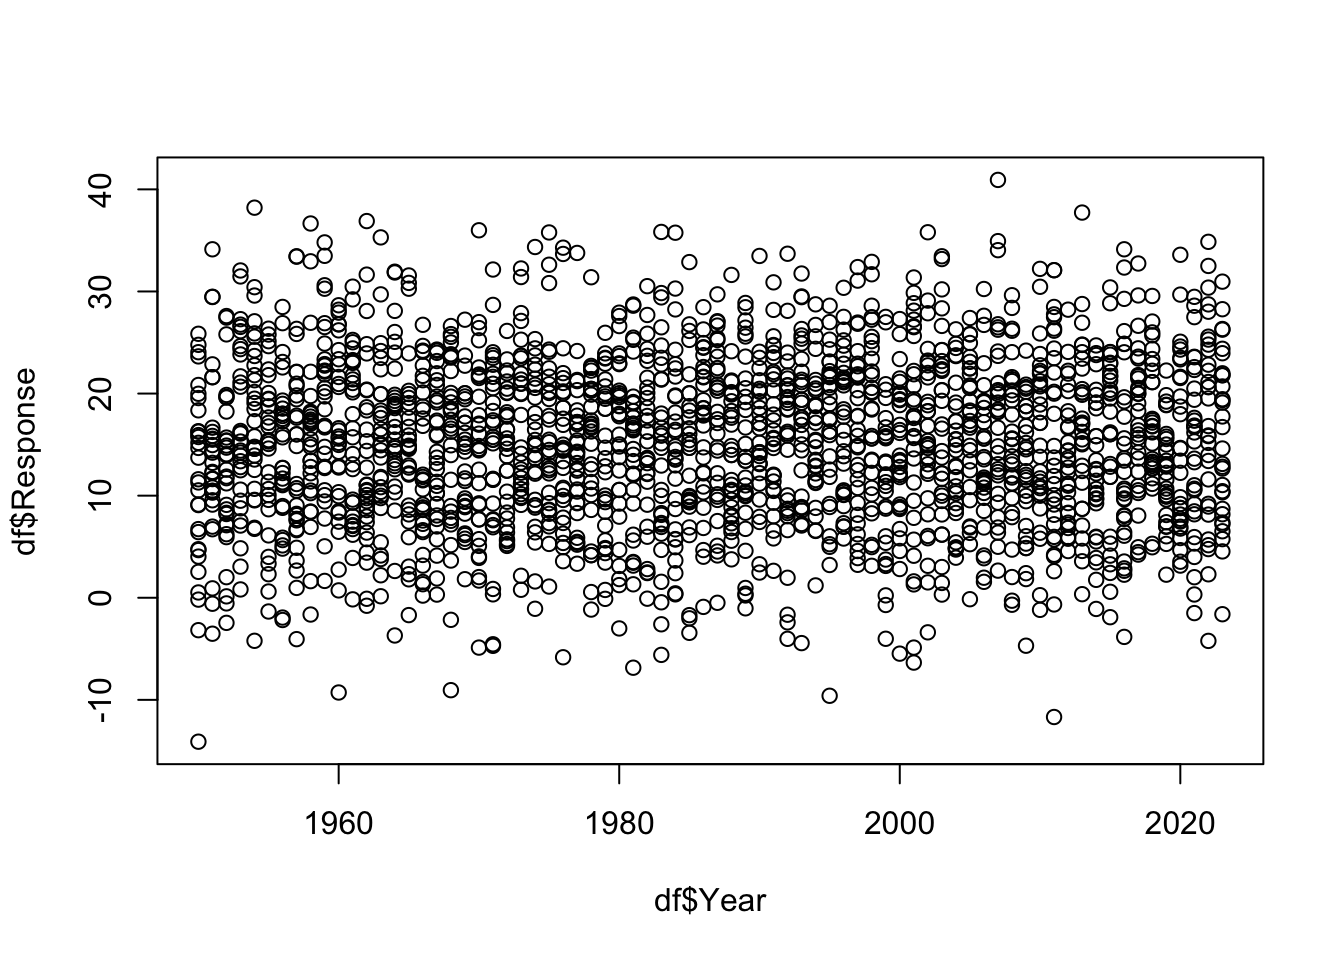
It automatically does a scatter plot, maybe we want to colour different treatments differently? and perhaps some axis labels that are more clear?
plot(x=df$Year,
     y=df$Response,
     col=df$Treatment,
     xlab="Year",
     ylab="Response")
Some of the arguments in this function are well named but you need to know the names of the arguments to properly use a function best,
you can easily find documentation of what arguments are within a function by typing two ? before the function in the console like so:
?plot()

# plot is a common function name
# so we have to go to the base::plot() section of the help
With the points coloured we should add a legend to the plot, this is accomplished with another function run after the plot function.
plot(x=df$Year,
     y=df$Response,
     col=unique(df$Treatment),
     xlab="Year",
     ylab="Response",
     pch=19)
legend(x = "topright",          # Position
       legend = unique(df$Treatment),  # Legend texts
       col = c(1,2, 3),           # point colors
       pch=19)                    # point type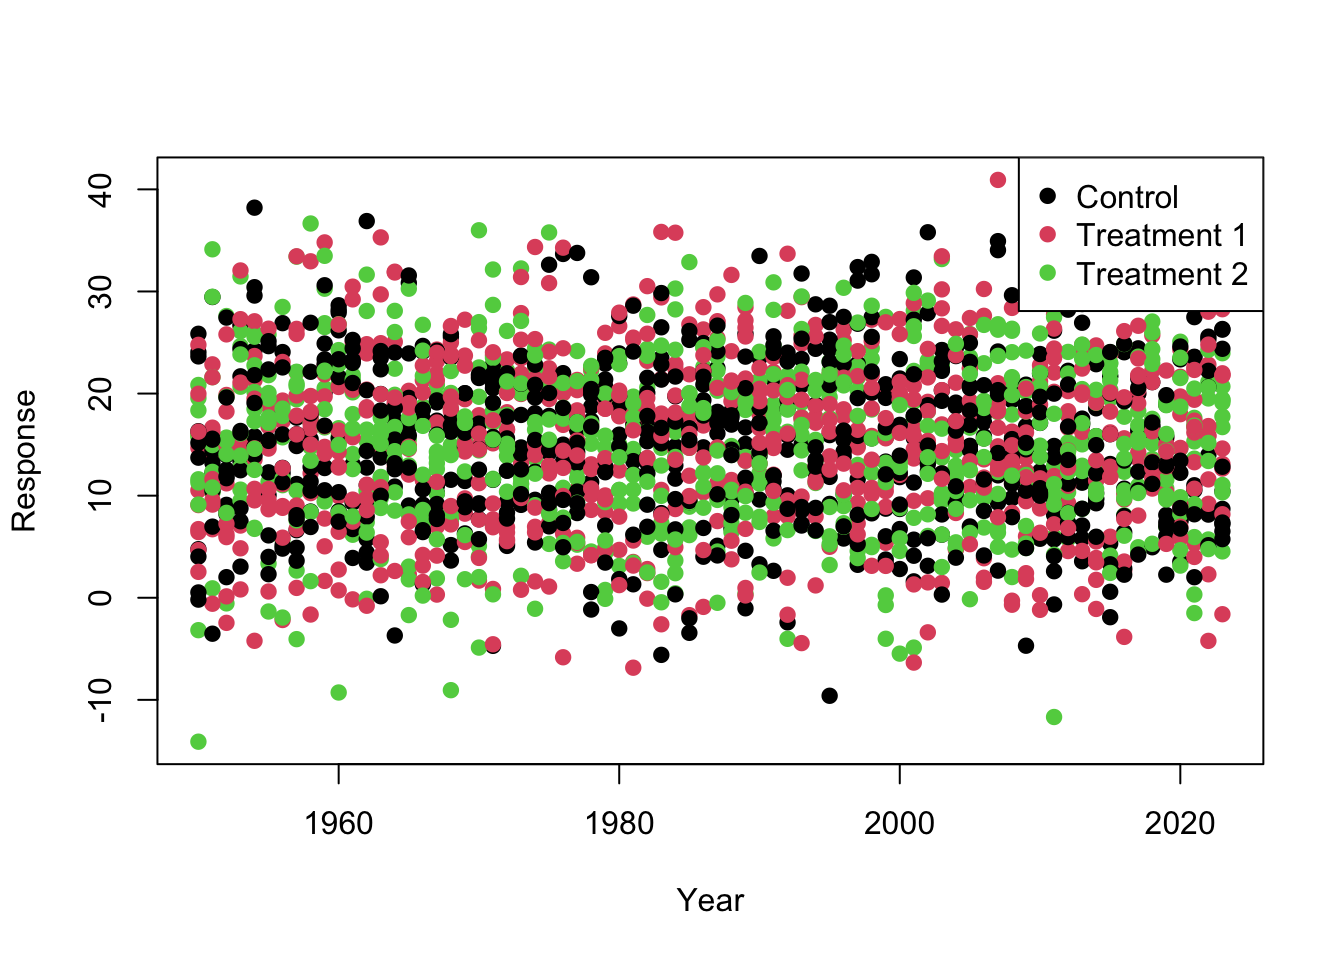
Here we can see that the response is totally random, regardless of treatment and year.
For interesting plotting we can change this, we can add patterns and jitter (random noise) to our data based on its treatment.
We will use some of our data manipulation code to do this.
library(tidyverse)── Attaching core tidyverse packages ──────────────────────── tidyverse 2.0.0 ──
✔ dplyr 1.1.4 ✔ readr 2.1.5
✔ forcats 1.0.0 ✔ stringr 1.5.1
✔ ggplot2 3.4.4 ✔ tibble 3.2.1
✔ lubridate 1.9.3 ✔ tidyr 1.3.1
✔ purrr 1.0.2
── Conflicts ────────────────────────────────────────── tidyverse_conflicts() ──
✖ dplyr::filter() masks stats::filter()
✖ dplyr::lag() masks stats::lag()
ℹ Use the conflicted package (<http://conflicted.r-lib.org/>) to force all conflicts to become errorsdf_1<-df %>%
mutate(Response_updated=case_when(
Treatment=="Control"~jitter(Response)*((Year-1930)/5)-50,
Treatment=="Treatment 1"~jitter(Response)*((Year-1930)*-2)+1000,
Treatment=="Treatment 2"~jitter(Response)*((Year-1930)*1.5)-4))We can now calculate some summary statistics such as mean or standard deviation using group_by and summarise
df_1_summary<-df_1 %>%
  group_by(Treatment) %>%
  summarise(MeanResponse=mean(Response_updated),
            SDResponse=sd(Response_updated))

df_1_summary
# A tibble: 3 × 3
Treatment MeanResponse SDResponse
<fct> <dbl> <dbl>
1 Control 119. 109.
2 Treatment 1 -663. 1192.
3 Treatment 2 1268. 858.df_1_summary_year<-df_1 %>%
group_by(Treatment,Year) %>%
summarise(MeanResponse=mean(Response_updated),
SDResponse=sd(Response_updated))`summarise()` has grouped output by 'Treatment'. You can override using the
`.groups` argument.df_1_summary_year# A tibble: 222 × 4
# Groups: Treatment [3]
Treatment Year MeanResponse SDResponse
<fct> <dbl> <dbl> <dbl>
1 Control 1950 9.58 20.4
2 Control 1951 11.9 30.8
3 Control 1952 21.0 50.5
4 Control 1953 25.9 28.1
5 Control 1954 8.58 35.0
6 Control 1955 33.9 43.9
7 Control 1956 21.5 25.3
8 Control 1957 43.6 45.9
9 Control 1958 44.5 54.4
10 Control 1959 48.7 49.7
# ℹ 212 more rowsggplot2
The Grammar of Graphics
For more complex (and very simple) plots ggplot2 is by far the best package!
The gg in ggplot2 and a lot of the associated packages stands for grammar of graphics, which is a very old framework for good visualisation.
We don’t need to go far into it, but it effectively relies on three elements:
Data
Mapping
Geometry
In every plot we will want to plot Data, it may be 1 value, 1 dimensional, 2 dimensional…. all the way up to multi facetted and dimensional.
We then want to assign some element of the data to elements of the plot, this is called mapping.
This mapping will change based on the geometry (shape/style).
For example earlier with base plot we Mapped a column (Data) to be the x axis and another to the y. (base plot assumed our geometry was a scatter plot)
Plotting
Using these principles we can build some very impressive and complicated plots.
We first make a blank ggplot saying what data we will include using ggplot().
For elements of the plot (aesthetics) that change with data from the df we use the aes() function to show what column we want to map to what element (mapping=aes()).
Then we want to add layers (geometries) to the plot for what we want to plot and how we want it to look.
ggplot(data=df_1,
       mapping=aes(x=Year,
                   y=Response_updated,
                   colour=Treatment))+
  geom_point()
This looks good but could be nicer! There are many geom types to dictate the type of plot.
Different geom types have different required aesthetic elements, we could check by using ??geom_point for example
Generally we use x, y, colour, fill and alpha (transparency). (Sometimes z or label or many others)
Unlike base plotting ggplot creates a legend automatically, this becomes more complex as the plot becomes more complex but is generally a nice default.
ggplot(df_1,aes(x=Response_updated,colour=Treatment))+
  geom_density()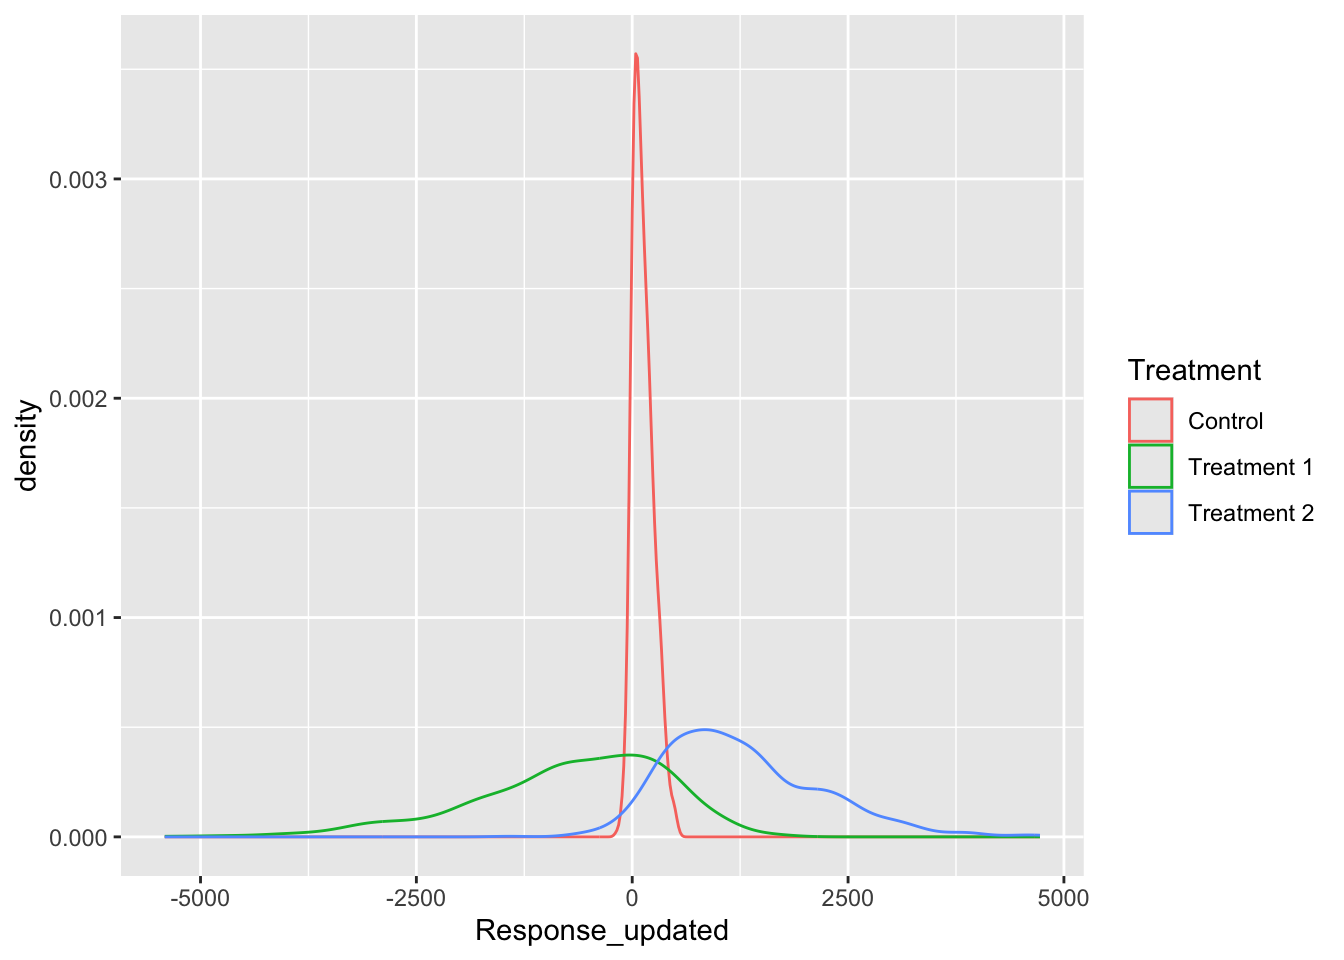
ggplot(df_1,aes(x=Year,y=Response_updated,fill=Treatment))+
  geom_col(alpha=0.5)
ggplot(df_1,aes(x=Treatment,y=Response_updated,fill=Treatment))+
  geom_boxplot(alpha=0.5)
We can also add new data into the same plot, so we could use the summary data too, for this we add the data to the geom (geometry) we want it used for.
Here we have both the fill and the colour with the same levels (Treatment), ggplot will automatically combine these into one legend.
ggplot()+
  geom_point(data=df_1,mapping=aes(x=Year,y=Response_updated,colour=Treatment),
             alpha=0.4)+
  geom_ribbon(data=df_1_summary_year,mapping=aes(x=Year,ymax=MeanResponse+SDResponse,
                                                 ymin=MeanResponse-SDResponse,fill=Treatment),
              alpha=0.4)+
  geom_line(data=df_1_summary_year,mapping=aes(x=Year,y=MeanResponse,colour=Treatment))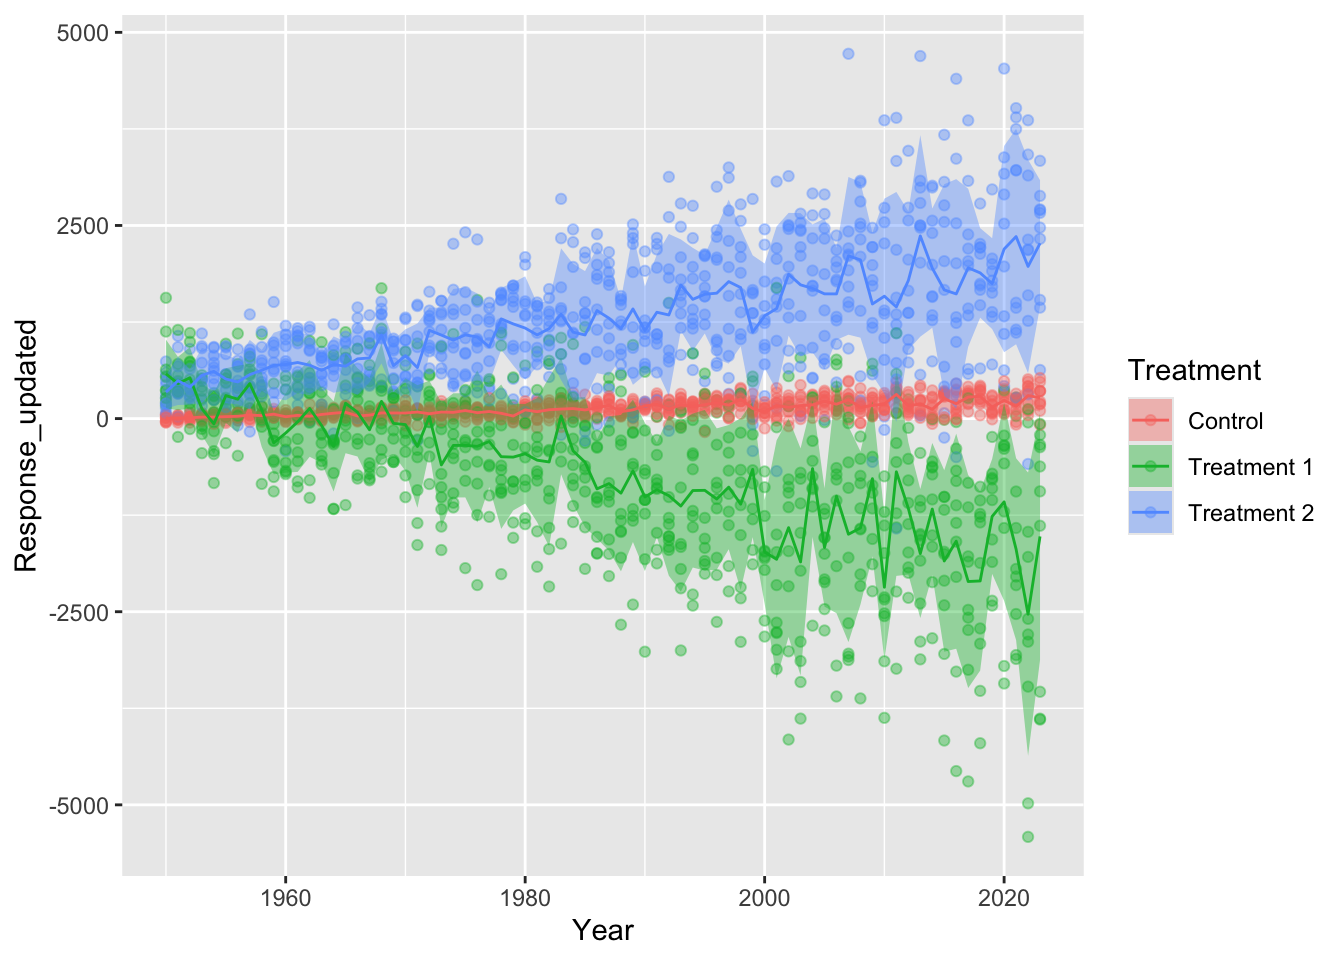
Appearance
We can now change the style and appearance of the whole plot with the function theme()
There are also some preset theme functions like theme_classic() or theme_bw()
We can also change the appearance with our mapping elements to define the colours or fill we want using the scale_colour_manual() and scale_fill_manual() functions. This is also true for all mapping, the x or y axis can be edited with scale_x/y_*() functions).
There are many different scale functions within ggplot so we some times use a * to say that it could be any that we use.
Maybe we want to set odd x breaks or flip the y axis upside down?
ggplot()+
  geom_point(data=df_1,mapping=aes(x=Year,y=Response_updated,colour=Treatment),
             alpha=0.4)+
  geom_ribbon(data=df_1_summary_year,mapping=aes(x=Year,ymax=MeanResponse+SDResponse,
                                                 ymin=MeanResponse-SDResponse,fill=Treatment),
              alpha=0.4)+
  geom_line(data=df_1_summary_year,mapping=aes(x=Year,y=MeanResponse,colour=Treatment))+
  scale_colour_manual(values=c("darkcyan","darkorange","grey30"))+
  scale_fill_manual(values=c("darkcyan","darkorange","grey30"))+
  scale_x_continuous(breaks = c(1955,1982,2010,2023))+
  scale_y_reverse()+
  labs(x="Year",y="Response Variable")+
  theme_classic()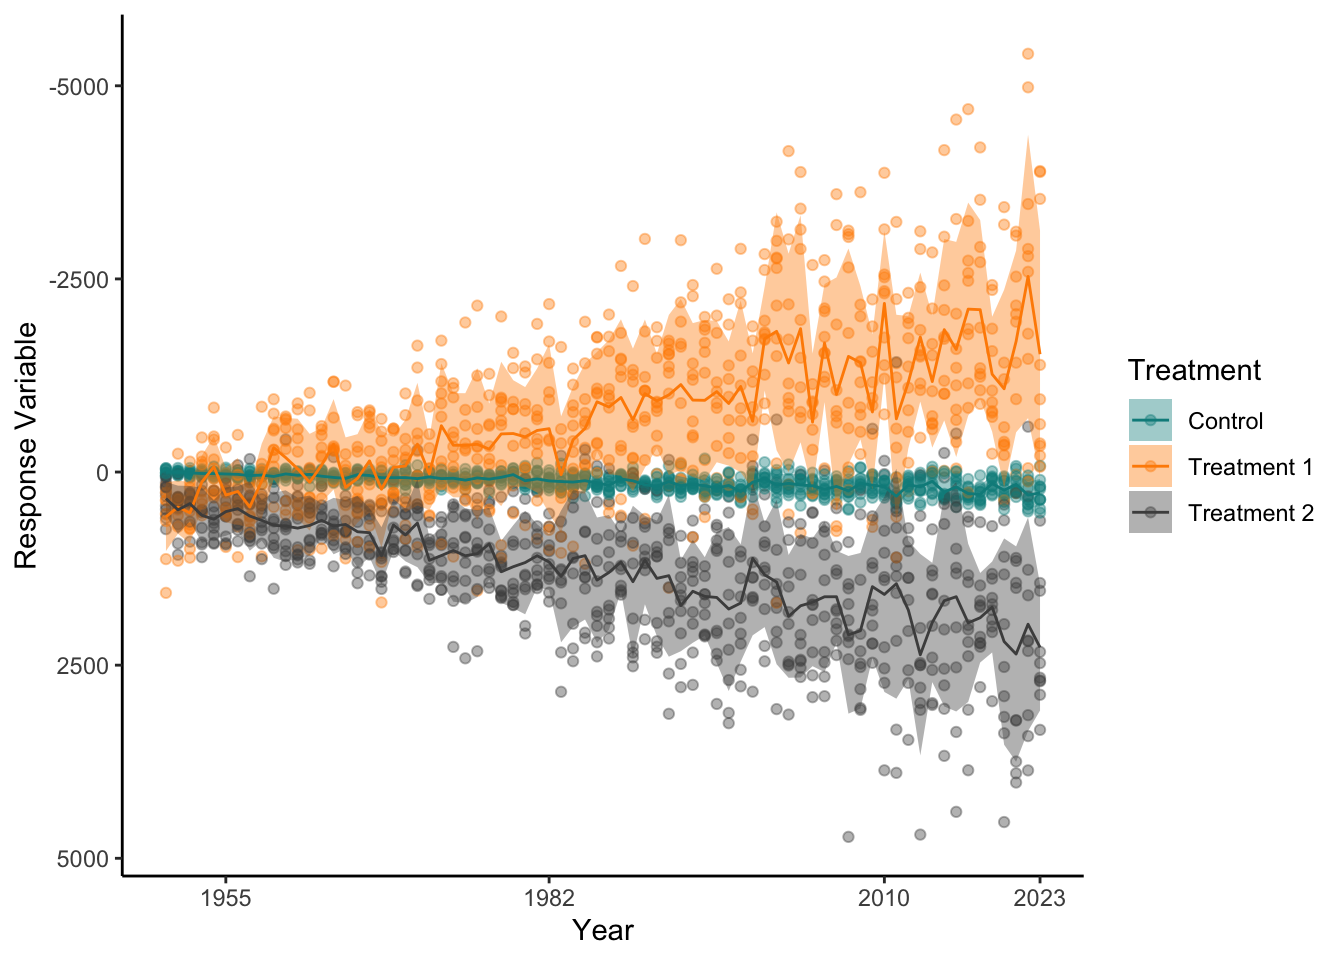
We could even separate plots by another column (facetting)
ggplot()+
  geom_point(data=df_1,mapping=aes(x=Year,y=Response_updated,colour=Treatment),
             alpha=0.4)+
  geom_ribbon(data=df_1_summary_year,mapping=aes(x=Year,ymax=MeanResponse+SDResponse,
                                                 ymin=MeanResponse-SDResponse,fill=Treatment),
              alpha=0.4)+
  geom_line(data=df_1_summary_year,mapping=aes(x=Year,y=MeanResponse,colour=Treatment))+
  facet_wrap(~Rep, nrow=2)+
  scale_color_manual(values=c("darkcyan","darkorange","grey30"))+
  scale_fill_manual(values=c("darkcyan","darkorange","grey30"))+
  labs(x="Year",y="Response Variable")+
  theme_classic()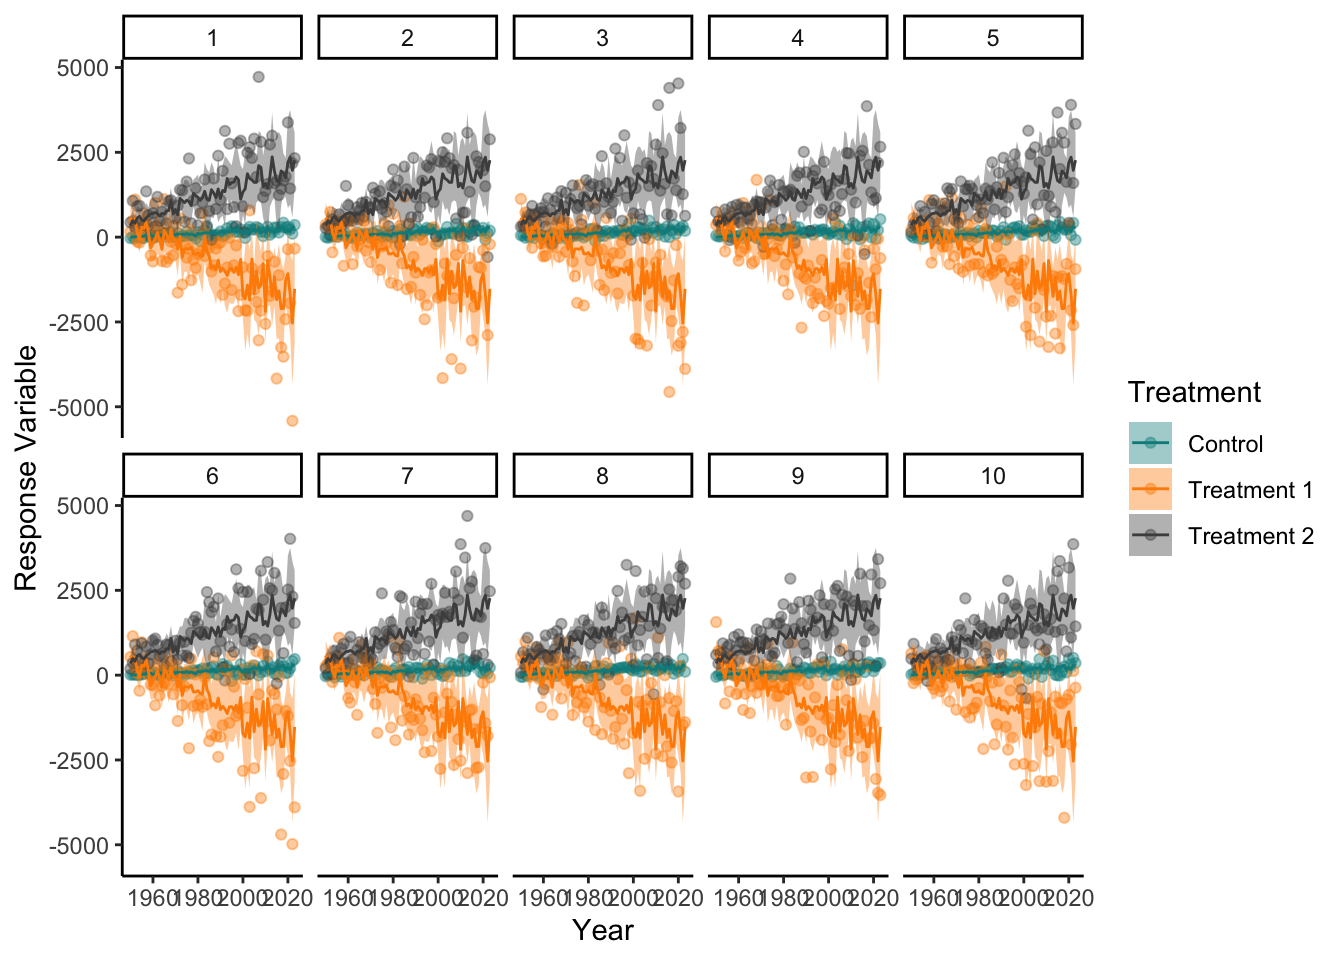
We can add up different layers but also edit all elements of the plot using either the theme() or scale_*_() functions
These are all the elements you can change within theme:
theme( line, rect, text, title, aspect.ratio, axis.title, axis.title.x, axis.title.x.top, axis.title.x.bottom, axis.title.y, axis.title.y.left, axis.title.y.right, axis.text, axis.text.x, axis.text.x.top, axis.text.x.bottom, axis.text.y, axis.text.y.left, axis.text.y.right, axis.ticks, axis.ticks.x, axis.ticks.x.top, axis.ticks.x.bottom, axis.ticks.y, axis.ticks.y.left, axis.ticks.y.right, axis.ticks.length, axis.ticks.length.x, axis.ticks.length.x.top, axis.ticks.length.x.bottom, axis.ticks.length.y, axis.ticks.length.y.left, axis.ticks.length.y.right, axis.line, axis.line.x, axis.line.x.top, axis.line.x.bottom, axis.line.y, axis.line.y.left, axis.line.y.right, legend.background, legend.margin, legend.spacing, legend.spacing.x, legend.spacing.y, legend.key, legend.key.size, legend.key.height, legend.key.width, legend.text, legend.text.align, legend.title, legend.title.align, legend.position, legend.direction, legend.justification, legend.box, legend.box.just, legend.box.margin, legend.box.background, legend.box.spacing, panel.background, panel.border, panel.spacing, panel.spacing.x, panel.spacing.y, panel.grid, panel.grid.major, panel.grid.minor, panel.grid.major.x, panel.grid.major.y, panel.grid.minor.x, panel.grid.minor.y, panel.ontop, plot.background, plot.title, plot.title.position, plot.subtitle, plot.caption, plot.caption.position, plot.tag, plot.tag.position, plot.margin, strip.background, strip.background.x, strip.background.y, strip.clip, strip.placement, strip.text, strip.text.x, strip.text.x.bottom, strip.text.x.top, strip.text.y, strip.text.y.left, strip.text.y.right, strip.switch.pad.grid, strip.switch.pad.wrap )
Each one can be edited by its own element, so for a background it is a rectangle so we might say (inside theme()) but for a grid line it is a line.
plot.background=element_rect(fill=“grey80”) this will mean the rectangular element of the plot background will be filled with the colour grey80
panel.grid.major.y= element_line(colour = “green”,linetype = “dotdash”,linewidth =2) this will mean the axis lines element of the panel background will be a green dotdashed line of linewidth 2 with the colour grey80
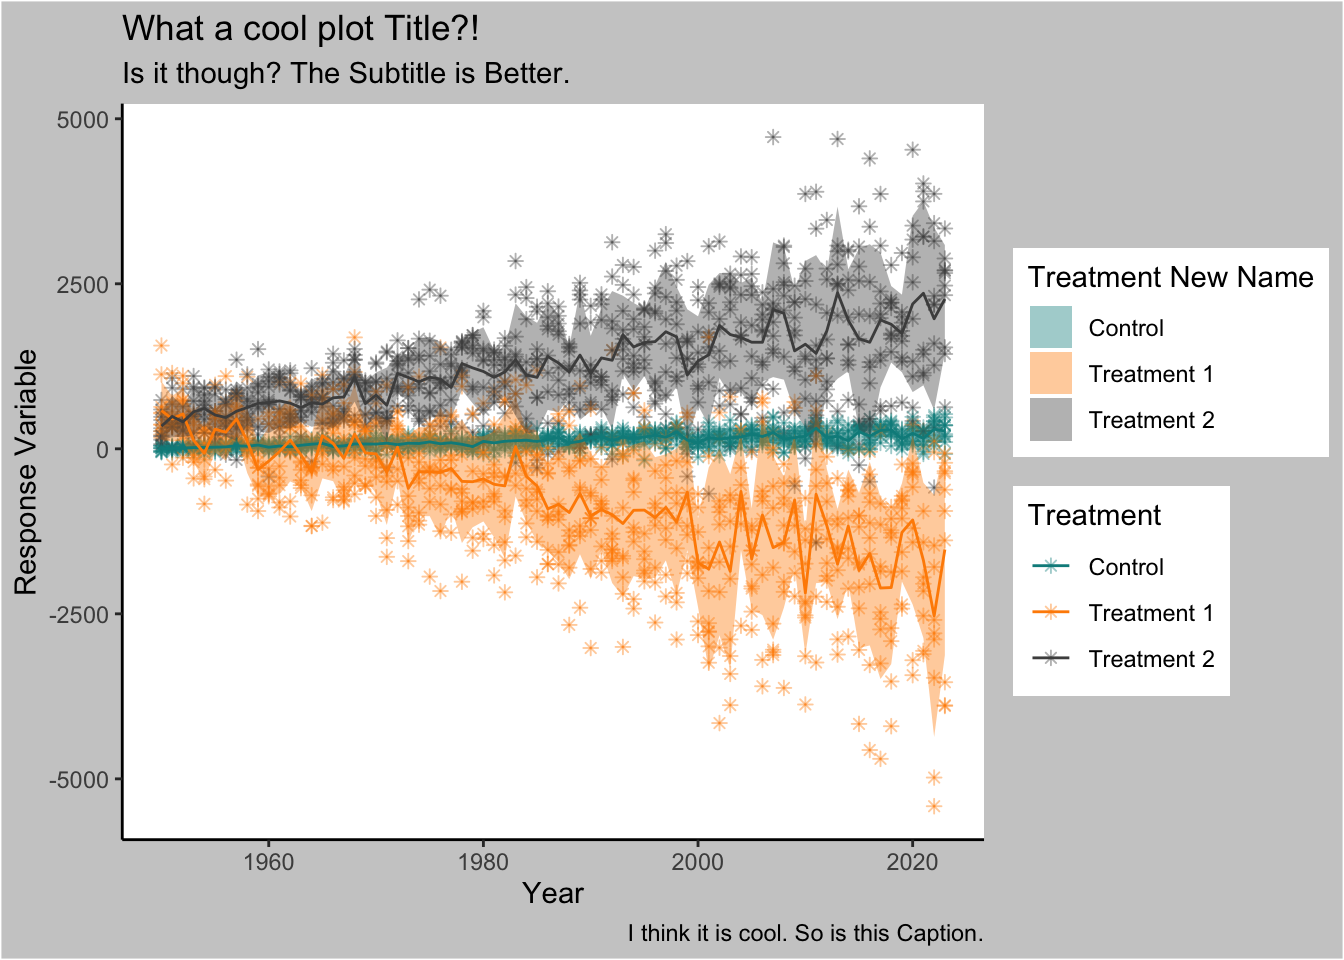
We can add titles and subtitles or change the legend title inside the labs function (if we only change the fill title it will split the colour and fill legends),
We can even add geoms that are labels or texts or other shapes/lines not base on our data
ggplot()+
  geom_point(data=df_1,mapping=aes(x=Year,y=Response_updated,colour=Treatment),
             alpha=0.4, shape=8)+
  geom_ribbon(data=df_1_summary_year,mapping=aes(x=Year,ymax=MeanResponse+SDResponse,
                                                 ymin=MeanResponse-SDResponse,fill=Treatment),
              alpha=0.4)+
  geom_line(data=df_1_summary_year,mapping=aes(x=Year,y=MeanResponse,colour=Treatment))+
  scale_color_manual(values=c("darkcyan","darkorange","grey30"))+
  scale_fill_manual(values=c("darkcyan","darkorange","grey30"))+
  labs(x="Year",
       y="Response Variable",
       fill="Treatment New Name",
       title= "What a cool plot Title?!",
       subtitle = "Is it though? The Subtitle is Better.",
       caption= "I think it is cool. So is this Caption."
       )+
  theme_classic()+
  theme(plot.background = element_rect(fill="grey80")

        )
ggplot()+
  geom_point(data=df_1,mapping=aes(x=Year,y=Response_updated,colour=Treatment),
             alpha=0.4, shape=8)+
  geom_ribbon(data=df_1_summary_year,mapping=aes(x=Year,ymax=MeanResponse+SDResponse,
                                                 ymin=MeanResponse-SDResponse,fill=Treatment),
              alpha=0.4)+
  geom_line(data=df_1_summary_year,mapping=aes(x=Year,y=MeanResponse,colour=Treatment))+
  scale_color_manual(values=c("darkcyan","darkorange","grey30"))+
  scale_fill_manual(values=c("darkcyan","darkorange","grey30"))+
  labs(x="Year",
       y="Response Variable",
       fill="Treatment New Name",
       title= "What a cool plot Title?!",
       subtitle = "Is it though? The Subtitle is Better.",
       caption= "I think it is cool. So is this Caption."
       )+
  theme_classic()+
  theme(plot.background = element_rect(fill="grey80"),
        panel.background = element_rect(fill="yellow")

        )+
  geom_text(aes(x=1980,y=3000,label="this is text"))
ggplot()+
  geom_point(data=df_1,mapping=aes(x=Year,y=Response_updated,colour=Treatment),
             alpha=0.4, shape=8)+
  geom_ribbon(data=df_1_summary_year,mapping=aes(x=Year,ymax=MeanResponse+SDResponse,
                                                 ymin=MeanResponse-SDResponse,fill=Treatment),
              alpha=0.4)+
  geom_line(data=df_1_summary_year,mapping=aes(x=Year,y=MeanResponse,colour=Treatment))+
  scale_color_manual(values=c("darkcyan","darkorange","grey30"))+
  scale_fill_manual(values=c("darkcyan","darkorange","grey30"))+
  labs(x="Year",
       y="Response Variable",
       fill="Treatment New Name",
       title= "What a cool plot Title?!",
       subtitle = "Is it though? The Subtitle is Better.",
       caption= "I think it is cool. So is this Caption."
       )+
  theme_classic()+
  theme(plot.background = element_rect(fill="grey80"),
        panel.background = element_rect(fill="yellow"),
        panel.grid.major.x= element_line(colour = "red",linetype = "dotted",linewidth =1)

        )+
  geom_text(aes(x=1980,y=3000,label="this is text"))+
  geom_label(aes(x=1980,y=4000,label="this is a label (has a background)"), colour="purple", fill="navyblue")
ggplot()+
  geom_point(data=df_1,mapping=aes(x=Year,y=Response_updated,colour=Treatment),
             alpha=0.4, shape=8)+
  geom_ribbon(data=df_1_summary_year,mapping=aes(x=Year,ymax=MeanResponse+SDResponse,
                                                 ymin=MeanResponse-SDResponse,fill=Treatment),
              alpha=0.4)+
  geom_line(data=df_1_summary_year,mapping=aes(x=Year,y=MeanResponse,colour=Treatment))+
  scale_color_manual(values=c("darkcyan","darkorange","grey30"))+
  scale_fill_manual(values=c("darkcyan","darkorange","grey30"))+
  labs(x="Year",
       y="Response Variable",
       fill="Treatment New Name",
       title= "What a cool plot Title?!",
       subtitle = "Is it though? The Subtitle is Better.",
       caption= "I think it is cool. So is this Caption."
       )+
  theme_classic()+
  theme(plot.background = element_rect(fill="grey80"),
        panel.background = element_rect(fill="yellow"),
        panel.grid.major.x= element_line(colour = "red",linetype = "dotted",linewidth =1),
        panel.grid.major.y= element_line(colour = "green",linetype = "dotdash",linewidth =2)

        )+
  geom_text(aes(x=1980,y=3000,label="this is text"))+
  geom_label(aes(x=1980,y=4000,label="this is a label (has a background)"), colour="purple", fill="navyblue")+
  geom_segment(aes(x=1960,xend=2020,y=2500,yend=-2500))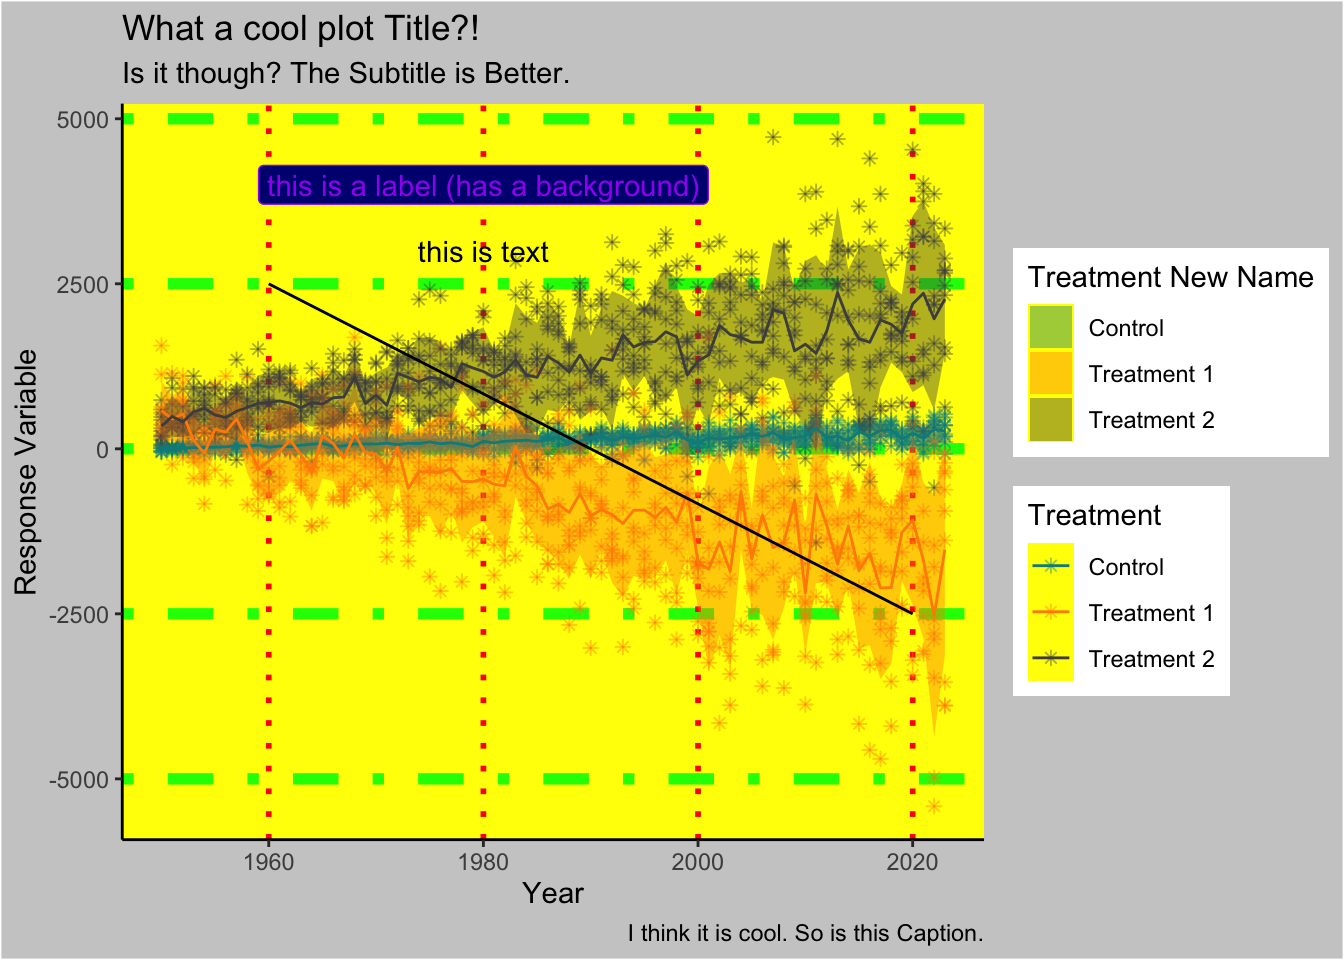
ggplot()+
  geom_point(data=df_1,mapping=aes(x=Year,y=Response_updated,colour=Treatment),
             alpha=0.4, shape=8)+
  geom_ribbon(data=df_1_summary_year,mapping=aes(x=Year,ymax=MeanResponse+SDResponse,
                                                 ymin=MeanResponse-SDResponse,fill=Treatment),
              alpha=0.4)+
  geom_line(data=df_1_summary_year,mapping=aes(x=Year,y=MeanResponse,colour=Treatment))+
  scale_color_manual(values=c("darkcyan","darkorange","grey30"))+
  scale_fill_manual(values=c("darkcyan","darkorange","grey30"))+
  labs(x="Year",
       y="Response Variable",
       fill="Treatment New Name",
       title= "What a cool plot Title?!",
       subtitle = "Is it though? The Subtitle is Better.",
       caption= "I think it is cool. So is this Caption."
       )+
  theme_classic()+
  theme(plot.background = element_rect(fill="grey80"),
        panel.background = element_rect(fill="yellow"),
        panel.grid.major.x= element_line(colour = "red",linetype = "dotted",linewidth =1),
        panel.grid.major.y= element_line(colour = "green",linetype = "dotdash",linewidth =2),
        panel.grid.minor.x= element_line(colour = "blue",linetype = "solid",linewidth =3),
        panel.grid.minor.y= element_line(colour = "pink",linetype = "solid",linewidth =2.5)

        )+
  geom_text(aes(x=1980,y=3000,label="this is text"))+
  geom_label(aes(x=1980,y=4000,label="this is a label (has a background)"), colour="purple", fill="navyblue")+
  geom_segment(aes(x=1960,xend=2020,y=2500,yend=-2500))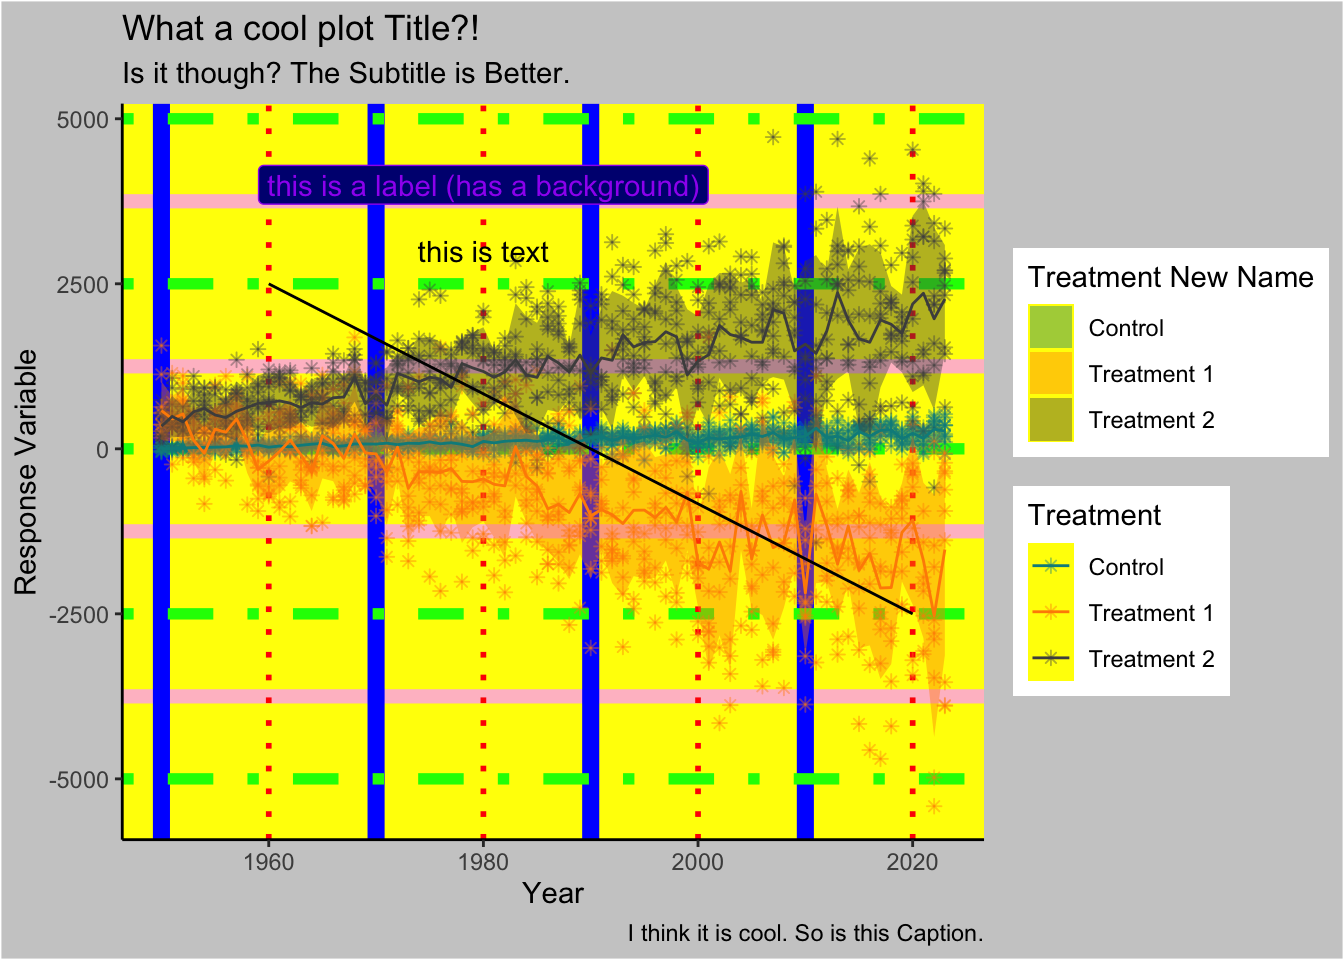
The above plot is horrendous but shows different important elements we might want to add or take away from plots.
Once we have got a plot to how we want it we can then save it as a file on our computer using the ggsave() function
to do this we can save our plot as an object, then provide the location we want to save the file and its name and extension in quotations, and its size,
we will save to the current directory.
Plot_To_Save<-ggplot()+
  geom_point(data=df_1,mapping=aes(x=Year,y=Response_updated,colour=Treatment),
             alpha=0.4)+
  geom_ribbon(data=df_1_summary_year,mapping=aes(x=Year,ymax=MeanResponse+SDResponse,
                                                 ymin=MeanResponse-SDResponse,fill=Treatment),
              alpha=0.4)+
  geom_line(data=df_1_summary_year,mapping=aes(x=Year,y=MeanResponse,colour=Treatment))+
  scale_color_manual(values=c("darkcyan","darkorange","grey30"))+
  scale_fill_manual(values=c("darkcyan","darkorange","grey30"))+
  labs(x="Year",y="Response Variable")+
  theme_classic()

ggsave("This_Is_Our_First_Saved_Plot.png", Plot_To_Save, width=10, height=10) # dont forget to put the file type at the end!!! we will use .png