Poisson GLMs

Introduction
R
GLMs
Stats
Poisson
Examples of Poisson GLMs
Published

September 28, 2023

Using Poisson GLMs

Data Loading Simple - Galapagos

Lets use a real-world dataset. This data set is the number of Plant species on different islands in the Galapagos Islands, how many of those species are endemic, the area of the island, its max elevation, the distance to the nearest island, its distance to santa cruz (the most populace island) and the area of the nearest island.

library(tidyverse)
── Attaching core tidyverse packages ──────────────────────── tidyverse 2.0.0 ──
✔ dplyr     1.1.4     ✔ readr     2.1.5
✔ forcats   1.0.0     ✔ stringr   1.5.1
✔ ggplot2   3.4.4     ✔ tibble    3.2.1
✔ lubridate 1.9.3     ✔ tidyr     1.3.1
✔ purrr     1.0.2     
── Conflicts ────────────────────────────────────────── tidyverse_conflicts() ──
✖ dplyr::filter() masks stats::filter()
✖ dplyr::lag()    masks stats::lag()
ℹ Use the conflicted package (<http://conflicted.r-lib.org/>) to force all conflicts to become errors
library(faraway)
library(patchwork)

data("gala")

glimpse(gala)
Rows: 30
Columns: 7
$ Species   <dbl> 58, 31, 3, 25, 2, 18, 24, 10, 8, 2, 97, 93, 58, 5, 40, 347, …
$ Endemics  <dbl> 23, 21, 3, 9, 1, 11, 0, 7, 4, 2, 26, 35, 17, 4, 19, 89, 23, …
$ Area      <dbl> 25.09, 1.24, 0.21, 0.10, 0.05, 0.34, 0.08, 2.33, 0.03, 0.18,…
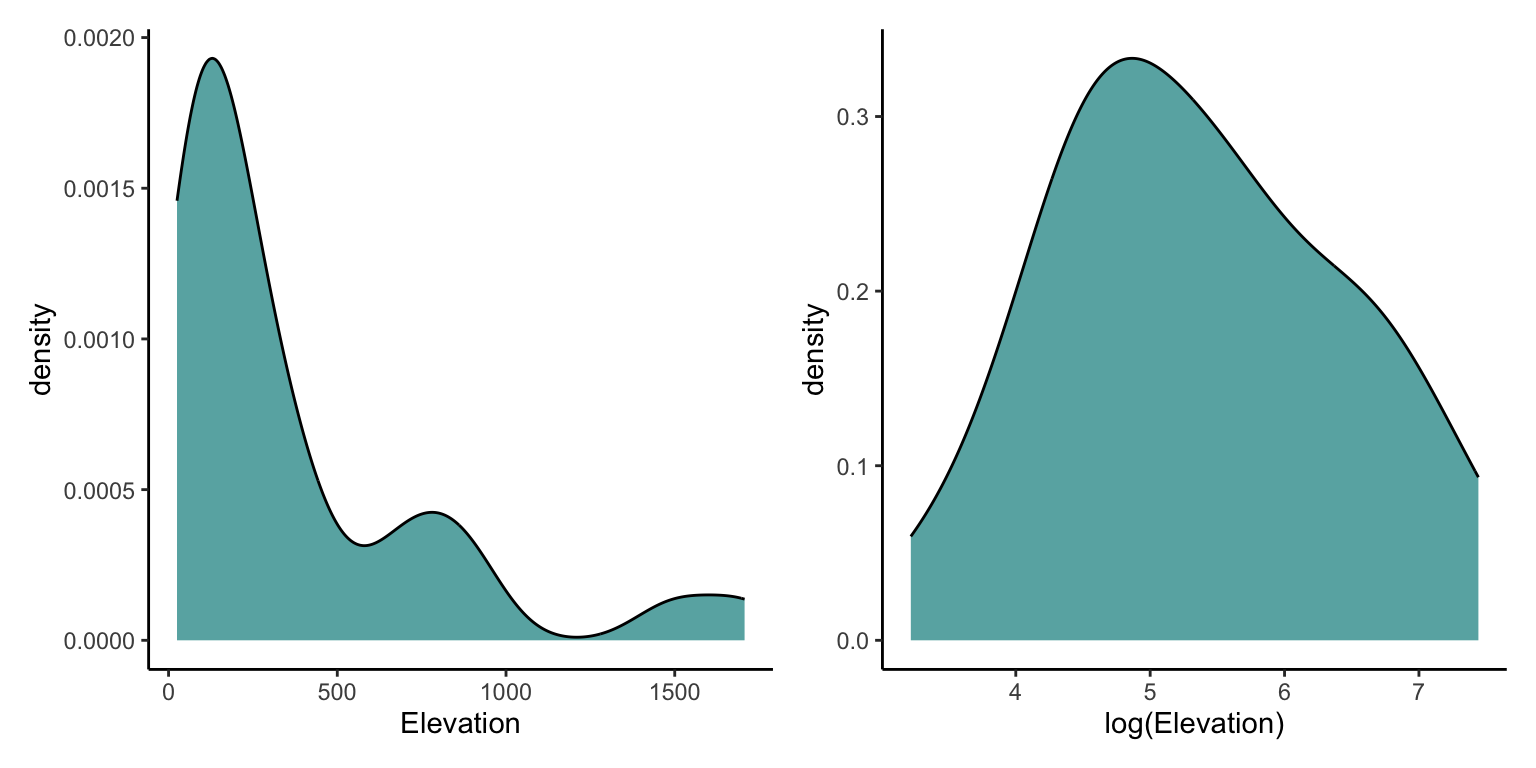
$ Elevation <dbl> 346, 109, 114, 46, 77, 119, 93, 168, 71, 112, 198, 1494, 49,…
$ Nearest   <dbl> 0.6, 0.6, 2.8, 1.9, 1.9, 8.0, 6.0, 34.1, 0.4, 2.6, 1.1, 4.3,…
$ Scruz     <dbl> 0.6, 26.3, 58.7, 47.4, 1.9, 8.0, 12.0, 290.2, 0.4, 50.2, 88.…
$ Adjacent  <dbl> 1.84, 572.33, 0.78, 0.18, 903.82, 1.84, 0.34, 2.85, 17.95, 0…

Step One - Scienctific Model to Stats Model

As an archipelago of volcanic islands the Galapagos were formed by geological processes, these geological processes such as tectonic movement and volcanic activity will have implications for the amount of endemic plant species on an island. Therefore, lets explore the relationship of plant endemism and physical features of the islands. For this example we will assess the effect of elevation of an island on the number of endemic species on that island.

This is a relatively simple model with just one fixed effect and can be written as:

Count of Endemic Plants ~ Elevation

Step Two - Resonse Variable Distribution

The number of endemic species is a count response where there is no theoretical limit (although one probably exists). Therefore the values can range from 0 upwards. This tells us that is most likely a Poisson distribution.

Step Three - Organising Fixed Effects

Often with highly variable numeric values, such as Elevation or Area or Population, we might need to transform our fixed effect with a log or a square root. We can assess the distribution of our Elevation variables to see if there is a a lot of variance across our islands.

p1<-ggplot(gala,aes(x=Elevation))+
  geom_density(fill="darkcyan",alpha=0.7)+
  theme_classic()


p2<-ggplot(gala,aes(x=log(Elevation)))+
  geom_density(fill="darkcyan",alpha=0.7)+
  theme_classic()

p1+p2

We seem to have a good spread of values across its range with some very large values so we will use a log transformation for modelling. We can then convert back to its native scale after modelling. Lets fit the model using the glm function, we add our statistical formula with the log transformed Elevation, our data and then we specify that the family or distribution we want to use is poisson.

df<-gala %>% 
  mutate(Elevation_log=log(Elevation))

glm1<-glm(Endemics~Elevation_log,data=df, family= "poisson")

Step Four - Assessing Model Functioning

library(patchwork)

ModelOutputs<-data.frame(Fitted=fitted(glm1),
                  Residuals=resid(glm1))

p3<-ggplot(ModelOutputs)+
    geom_point(aes(x=Fitted,y=Residuals))+
    theme_classic()+
    labs(y="Residuals",x="Fitted Values")

p4<-ggplot(ModelOutputs) +
    stat_qq(aes(sample=Residuals))+
    stat_qq_line(aes(sample=Residuals))+
    theme_classic()+
    labs(y="Sample Quartiles",x="Theoretical Quartiles")


p3+p4

We see some fairly mixed results here. The normality of residuals is good with almost all points following the line, whereas our homogenerity of variance is not amazing, which is likely being driven by a low number of high elevation values. However, the general patterns are quite spread but with very large values showing some overdispersion. This over dispersion might make us want to use a distribution that is more able to deal with over dispersion, such as Negative Binomial. We will accept the amount of over dispersion here as it is quite minor and only at the largest values, which are being driven by our highest value of Elevation and highest value of Endemism: Fernandina and Santa Cruz

summary(glm1)

Call:
glm(formula = Endemics ~ Elevation_log, family = "poisson", data = df)

Coefficients:
              Estimate Std. Error z value Pr(>|z|)    
(Intercept)   -1.32549    0.23027  -5.756  8.6e-09 ***
Elevation_log  0.79088    0.03657  21.626  < 2e-16 ***
---
Signif. codes:  0 '***' 0.001 '**' 0.01 '*' 0.05 '.' 0.1 ' ' 1

(Dispersion parameter for poisson family taken to be 1)

    Null deviance: 743.55  on 29  degrees of freedom
Residual deviance: 223.50  on 28  degrees of freedom
AIC: 360.45

Number of Fisher Scoring iterations: 5

Okay there are a lot of numbers here but what does it actually mean?

Lets write out the equation for the model, then we can use the values from the summary to create an equation for the model (the predict function will do this for us).

If we wanted to we could write out our model as this:

\[Count of Endemic Species = Poisson(\lambda)\]

\[\lambda=log(y)\]

\[ \begin{aligned} y = \beta_{1} log Elevation + Intercept \end{aligned} \]

As the Poisson distribution requires only one shape parameter (\(\lambda\)) and this must be zero or above, we must convert out linear equation results (\(y\)) so that it is non-negative. This means we use the link function, which for poisson models is by default a log. We can use a different link function if we want, or even check to check which link was used.

glm1$family$link
[1] "log"

When we plot the estimates into this equation, this should be similar to our raw data but not identical. Remember we are creating a model to Generalise the patterns of the raw data, not copy them!

Step Five - Model Interpretation

Thankfully we don’t have to extract each \(\beta\) parameter from the summary table as R has useful functions that can do this for us! To do this we make simulated raw data with the same predictor variables in.

We then use the model to predict() the response variable based on those predictor variables.

Therefore, we make a data set with just Elevation (on the log scale) the same as our original data (be careful of spelling and capitalisation, R wants it identical).

The model then predicts the average Count of Endemic Species based on those log Elevations.

We can also tell the predict function to predict error (Standard Error here that we then convert to an approximation of the 95% confidence interval).

Note that here I tell Predict that I want the fit to be returned on the response scale and not the link scale.

NewData_1<-data.frame(Elevation_log=seq(min(df$Elevation_log),max(df$Elevation_log),length.out=50))

Pred<-predict(glm1,NewData_1,se.fit=TRUE,type="response")

NewData<-NewData_1 %>% 
  mutate(response=Pred$fit,
         se.fit=Pred$se.fit,
         Upr=response+(se.fit*1.96),
         Lwr=response-(se.fit*1.96),
         Elevation=exp(Elevation_log))

ggplot(NewData)+
  geom_ribbon(aes(x=Elevation,
                    ymax=Upr,
                    ymin=Lwr),
              alpha=0.7,
              fill="darkcyan")+
  geom_line(aes(x=Elevation,
                 y=response),
              colour="darkcyan")+
  labs(x="Elevation",y="Response Variable (Count of Endemic Plant Species)")+
  theme_classic()

Now lets plot this model output over the raw values to see how well the model has worked.

ggplot(NewData)+
  geom_point(data=df,aes(x=Elevation,
                         y=Endemics),
              alpha=0.3,
             size=0.8,
             colour="darkcyan")+
  geom_ribbon(aes(x=Elevation,
                    ymax=Upr,
                    ymin=Lwr),
              alpha=0.7,
              fill="darkcyan")+
  geom_line(aes(x=Elevation,
                 y=response),
              colour="darkcyan")+
  labs(x="Elevation",y="Response Variable (Count of Endemic Plant Species)")+
  theme_classic()

Some Caveats

Now this looks quite good, with more uncertainty at higher values where there are less values to influence the prediction. This is a very simplified model that is not taking into consideration many different factors. For example, Age of an island is highly influential on its plant communities as well as the volcanic activity. So from a science point of view this is not the whole story, infact the Elevation may be just a proxy for the amount of available habitat space and the potential for habitat niches that are influential on endemism. Other factors such as human occupation and the influence that has caused in Galapagos on the local plant populations should not be ignored: invasive species, agricultural practices etc.

Data Loading Complex - Epilepsy

Lets create a more complex poisson model. This data set is the number of epileptic seizures from 59 patients in a clinical trial of a treatment. Patients were given a a treatment of Placebo or a drug called Progabide. There is a base number of seizures for the 8 weeks before the trial and then a seizure rate for every 2 week period (up to 8 weeks) after being given a treatment. Patients Ages are also available. We will summarise all seizures had by a patient in the 4 periods post treatment to make this a simpler assessment. Although, we could have assessed an effect over time post treatment as well. (Another day perhaps)

# install.packages("HSAUR2")

library(HSAUR2)
Loading required package: tools

Attaching package: 'HSAUR2'
The following objects are masked from 'package:faraway':

    epilepsy, toenail
The following object is masked from 'package:tidyr':

    household
data("epilepsy")

glimpse(epilepsy)
Rows: 236
Columns: 6
$ treatment    <fct> placebo, placebo, placebo, placebo, placebo, placebo, pla…
$ base         <int> 11, 11, 11, 11, 11, 11, 11, 11, 6, 6, 6, 6, 8, 8, 8, 8, 6…
$ age          <int> 31, 31, 31, 31, 30, 30, 30, 30, 25, 25, 25, 25, 36, 36, 3…
$ seizure.rate <int> 5, 3, 3, 3, 3, 5, 3, 3, 2, 4, 0, 5, 4, 4, 1, 4, 7, 18, 9,…
$ period       <ord> 1, 2, 3, 4, 1, 2, 3, 4, 1, 2, 3, 4, 1, 2, 3, 4, 1, 2, 3, …
$ subject      <fct> 1, 1, 1, 1, 2, 2, 2, 2, 3, 3, 3, 3, 4, 4, 4, 4, 5, 5, 5, …
df_epilepsy<-epilepsy %>% 
  group_by(age,base,subject,treatment) %>% 
  summarise(seizures=sum(seizure.rate))
`summarise()` has grouped output by 'age', 'base', 'subject'. You can override
using the `.groups` argument.

Step One - Scienctific Model to Stats Model

We will assess the number of seizures in the 8 weeks after treatment for patients and assess whether this pattern changes with age and the number of seizures they had before treatment.

This is a bit more complex model with two interacting fixed effect and one additional fixed effect and can be written as:

Count of Seizures After Treatment ~ Treatment*Age + Base Number of Seizures

Step Two - Resonse Variable Distribution

Again, the number of seizures can only be a non-negative integer.

Step Three - Organising Fixed Effects

Lets check all our fixed effects. For numeric values we can assess their distribution, categorical we can see the number of samples is relatively even.

p1<-ggplot(df_epilepsy,aes(x=age))+
  geom_density(fill="darkcyan",alpha=0.7)+
  theme_classic()


p2<-ggplot(df_epilepsy,aes(x=treatment))+
  geom_bar(fill="darkcyan",alpha=0.7)+
  theme_classic()

p3<-ggplot(df_epilepsy,aes(x=base))+
  geom_density(fill="darkcyan",alpha=0.7)+
  theme_classic()
  
p4<-ggplot(df_epilepsy,aes(x=sqrt(base)))+
  geom_density(fill="darkcyan",alpha=0.7)+
  theme_classic()

(p1+p2)/(p3+p4)

Our factors age and treatment seem fine, but maybe we should square root the base effect so we don’t have really big base values influencing our model as much. We could log here or centre and scale but we shall use square root for now.

df<-df_epilepsy %>% 
  mutate(base_sqrt=sqrt(base))

glm2<-glm(seizures~treatment*age+base_sqrt,data=df, family= "poisson")

Step Four - Assessing Model Functioning

ModelOutputs<-data.frame(Fitted=fitted(glm2),
                  Residuals=resid(glm2))

p3<-ggplot(ModelOutputs)+
    geom_point(aes(x=Fitted,y=Residuals))+
    theme_classic()+
    labs(y="Residuals",x="Fitted Values")

p4<-ggplot(ModelOutputs) +
    stat_qq(aes(sample=Residuals))+
    stat_qq_line(aes(sample=Residuals))+
    theme_classic()+
    labs(y="Sample Quartiles",x="Theoretical Quartiles")


p3+p4

As earlier, we see some fairly mixed results here. The normality of residuals is good with almost all points following the line, whereas our homogenerity of variance is again not amazing, which is likely being driven by a low number of high base seizure values values. However, the general patterns are quite spread but with very large values showing some overdispersion. This over dispersion might make us want to use a distribution that is more able to deal with over dispersion, such as Negative Binomial. We will accept the amount of over dispersion here as it is quite minor and only at the largest values.

summary(glm2)

Call:
glm(formula = seizures ~ treatment * age + base_sqrt, family = "poisson", 
    data = df)

Coefficients:
                        Estimate Std. Error z value Pr(>|z|)    
(Intercept)             0.483382   0.182272   2.652   0.0080 ** 
treatmentProgabide      0.317571   0.226665   1.401   0.1612    
age                     0.029911   0.005555   5.385 7.25e-08 ***
base_sqrt               0.357709   0.008901  40.187  < 2e-16 ***
treatmentProgabide:age -0.013838   0.007903  -1.751   0.0799 .  
---
Signif. codes:  0 '***' 0.001 '**' 0.01 '*' 0.05 '.' 0.1 ' ' 1

(Dispersion parameter for poisson family taken to be 1)

    Null deviance: 2122.73  on 58  degrees of freedom
Residual deviance:  490.77  on 54  degrees of freedom
AIC: 784.04

Number of Fisher Scoring iterations: 5

Okay there are a lot of numbers here but what does it actually mean?

Lets write out the equation for the model, then we can use the values from the summary to create an equation for the model (the predict function will do this for us).

If we wanted to we could write out our model as this:

\[Count of Seizures Post Treatment = Poisson(\lambda)\]

\[\lambda=log(y)\]

\[ \begin{aligned} y = \beta_{1} treatment:age\\ + \beta_{2} \sqrt{base} \\ + \beta_{3} age\\ + \beta_{4} treatment\\ + Intercept \end{aligned} \]

As the Poisson distribution requires only one shape parameter (\(\lambda\)) and this must be zero or above, we must convert out linear equation results (\(y\)) so that it is non-negative. This means we use the link function, which for poisson models is by default a log. We can use a different link function if we want, or even check to check which link was used.

glm2$family$link
[1] "log"

When we plot the estimates into this equation, this should be similar to our raw data but not identical. Remember we are creating a model to Generalise the patterns of the raw data, not copy them!

Step Five - Model Interpretation

Thankfully we don’t have to extract each \(\beta\) parameter from the summary table as R has useful functions that can do this for us! To do this we make simulated raw data with the same predictor variables in.

We then use the model to predict() the response variable based on those predictor variables.

Therefore, we make a data set with age, treatment and base level the same as our original data (be careful of spelling and capitalisation, R wants it identical).

We will choose a low, middle and high base level

The model then predicts the average Count of Seizures based on those ages, treatments and base levels.

As we have two continuous fixed effects we could plot as heatmap style if we wanted. But then it is difficult or impossible to display confidence levels well.

We can also tell the predict function to predict error (Standard Error here that we then convert to an approximation of the 95% confidence interval).

Note that here I tell Predict that I want the fit to be returned on the response scale and not the link scale.

NewData_1<-expand.grid(base_sqrt=seq(min(df$base_sqrt),max(df$base_sqrt),length.out=100),
                       age=seq(min(df$age),max(df$age),length.out=50),
                       treatment=c("placebo","Progabide"))

Pred<-predict(glm2,NewData_1,se.fit=TRUE,type="response")

NewData<-NewData_1 %>% 
  mutate(response=Pred$fit,
         se.fit=Pred$se.fit,
         Upr=response+(se.fit*1.96),
         Lwr=response-(se.fit*1.96),
         base=base_sqrt^2,
         treatment=if_else(treatment=="placebo","Placebo",treatment))

ggplot(NewData)+
  geom_tile(aes(x=age,y=base,fill=response),
            alpha=0.9)+
  scale_y_sqrt()+
  scale_fill_viridis_c(direction=-1)+
  facet_wrap(~treatment)+
  labs(x="Age",y="Base Number of Seizures",fill="Predicted Number\nof Seizures")+
  theme_classic()

Now lets plot this model output with the raw values to see how well the model has worked.

df_1<-df %>% 
  mutate(treatment=if_else(treatment=="placebo","Placebo",treatment))

ggplot(NewData)+
  geom_tile(aes(x=age,y=base,fill=response),
            alpha=0.9)+
  geom_point(data=df_1,aes(x=age,y=base,fill=seizures),shape=21,colour="#FFFFFF50")+
  scale_y_sqrt()+
  scale_fill_viridis_c(direction=-1,limits=c(0,470))+
  scale_colour_viridis_c(direction=-1,limits=c(0,470))+
  facet_wrap(~treatment)+
  labs(x="Age",y="Base Number of Seizures",fill="Number\nof Seizures",colour="Number\nof Seizures")+
  theme_classic()

The patterns of colour from points to back ground do seem to generalise well. However, from this plot we can see clearly that the model is predicting in the age/base space that is not in the original data, so perhaps it would be better to plot the model assuming an average base level of seizures then compare with the raw data. We can also display the models confidence then too.

NewData_2<-expand.grid(base_sqrt=sqrt(mean(df$base)),
                       age=seq(min(df$age),max(df$age),length.out=50),
                       treatment=c("placebo","Progabide"))

Pred_3<-predict(glm2,NewData_2,se.fit=TRUE,type="response")

NewData_MeanBase<-NewData_2 %>% 
  mutate(response=Pred_3$fit,
         se.fit=Pred_3$se.fit,
         Upr=response+(se.fit*1.96),
         Lwr=response-(se.fit*1.96),
         base=base_sqrt^2,
         treatment=if_else(treatment=="placebo","Placebo",treatment))

ggplot(NewData_MeanBase)+
  geom_point(data=df_1,aes(x=age,y=seizures,colour=treatment))+
   geom_ribbon(aes(x=age,
                     ymax=Upr,
                     ymin=Lwr,
                   fill=treatment),
               alpha=0.7)+
   geom_line(aes(x=age,
                  y=response,
                   colour=treatment))+
   scale_colour_manual(values=c("darkcyan","darkorange"))+
   scale_fill_manual(values=c("darkcyan","darkorange"))+
   scale_y_continuous(limits=c(0,100))+
   labs(x="Age",y="Response Variable (Count of Seizures)",colour="Treatment",fill="Treatment")+
   theme_classic()
Warning: Removed 3 rows containing missing values (`geom_point()`).

I have set the y axis to ignore very large values (above 100) so we can see clearly what the model is telling us.

This shows a clearer picture and helps us understand that the model has seen some differences between the treatments and that this difference becomes more distinct with age. Although the differences are very minimal between treatments. But a clear increase in Seizures with increasing age regardless of treatment. This model (which is simplistic and probably not fully adequate at addressing this question) would not give us evidence that the drug is significantly different from placebo but we might infer there is some lessening of the effect of age in the Progabide treatment.